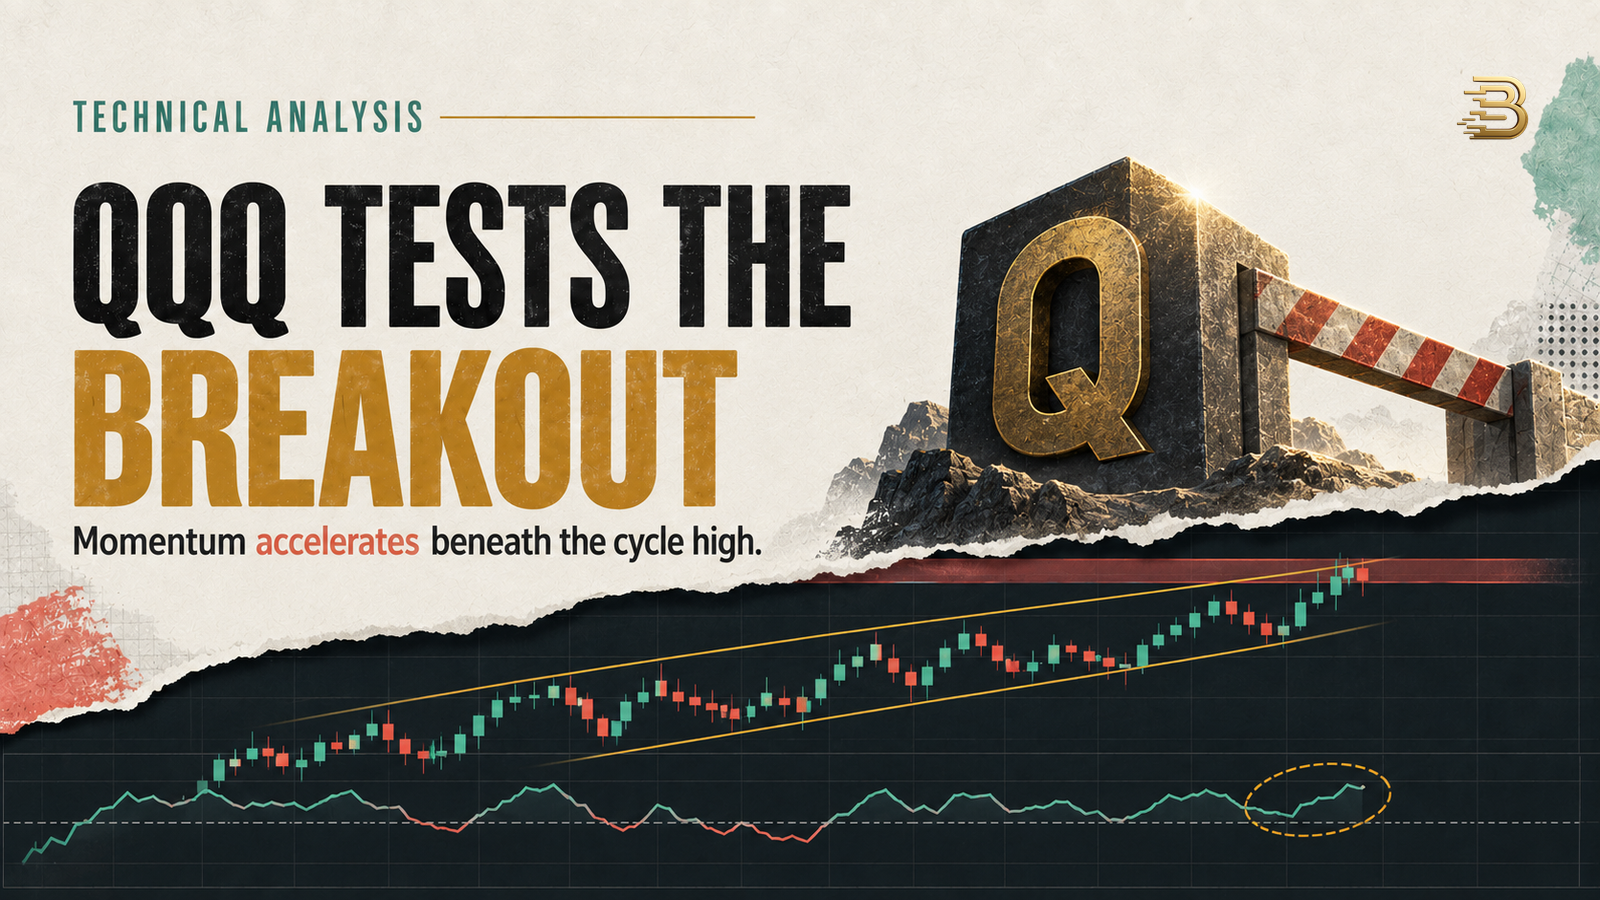
QQQ technical analysis has shifted from consolidation to breakout pressure, but the decisive test is still overhead at $748.43. The latest completed Invesco QQQ Trust daily candle opened at $728.04, traded as high as $743.22 and closed at $741.41 after a wide advance. That move cleared the August swing high at $734.56 and pushed price well above the fast trend cluster, with EMA 12 at $717.78 and EMA 26 at $715.36. RSI 14 rose to 65.65, while MACD crossed firmly above its signal line. Momentum is constructive, yet the chart is not in open price discovery. The June cycle high at $748.43 stands less than one daily ATR above the close, so the next completed candles must show whether Monday’s surge created durable acceptance or merely delivered QQQ into established supply.

The market tension is unusually clear. Bulls have a strong expansion candle, rising moving averages and a fresh momentum impulse. Bears have a major prior high directly above price, a close stretched more than two ATRs above EMA 12 and a macro backdrop in which higher rates can still compress the valuation of long duration growth companies. A completed close above $748.43 would turn the June ceiling into a breakout reference and expose the psychological $760 to $770 area. Failure near $748, followed by a close back below $734.56, would convert the move into a possible bull trap and return attention to $727.84, $721.86 and the moving average cluster near $712 to $718. The base case is bullish continuation only while the former resistance band begins to act as support.

🔍 The five levels that control the QQQ chart
The first level is $748.43, the June 3 cycle high. It is more important than the round $750 figure because it records the highest traded price in the completed 2026 series. QQQ challenged the broader $744 to $748 region several times during June without sustaining a breakout. The September 21 candle reached $743.22, leaving a narrow gap between current price and that old supply. A close above $748.43 would be the first objective confirmation that buyers absorbed the entire summer ceiling. An intraday print above it would be contact, not confirmation. The stronger signal would be a completed close above the level, followed by a pullback that holds roughly $741 to $748 as support.
The second level is $741.41, the latest completed close. It now functions as the most immediate momentum reference. If QQQ can hold above $741 during a shallow consolidation, the market would show that investors are willing to transact near the upper end of Monday’s range instead of taking quick profits. The third level is $734.56, the August 17 swing high that Monday’s candle cleared decisively. This is the first meaningful breakout support. A retreat into $734 to $728 can remain constructive if it produces a higher low and a strong close. A completed close below $727.84, Monday’s low, would weaken the impulse because it would erase the entire breakout candle.
The fourth level is $721.86, the September 8 swing high and the upper edge of the prior consolidation. This zone also sits close to recent highs around $721 to $724, making it a natural retest area if the market needs a deeper reset. The fifth level is $700.04, the September 16 low. That low completed the latest pullback and launched the three session advance into resistance. Losing $700 would break the sequence that produced the current breakout attempt and expose the July low near $661.15, with EMA 200 currently rising near $669.47. The distance between $748 and $700 is wide, but it maps the full structure from breakout confirmation to trend invalidation.
| Zone | Technical role | Bullish confirmation | Failure signal |
|---|---|---|---|
| $748.43 to $750 | Cycle high and primary breakout gate | Completed close above $748.43, then a successful retest | Rejection followed by a close below $734.56 |
| $741.41 to $734.56 | Immediate acceptance band | Several closes holding the upper half of the breakout candle | Fast reversal through $734.56 |
| $727.84 to $721.86 | Breakout base and first deeper support | Higher low followed by a reclaim of $734.56 | Acceptance below $721.86 |
| $717.78 to $712.33 | EMA 12, EMA 26 and EMA 50 cluster | Momentum reset while averages continue rising | Fast averages roll over and price cannot reclaim them |
| $704.68 to $700.04 | September structure floor | Demand appears before a completed breakdown | Daily close below $700 |
| $669.47 to $661.15 | EMA 200 and July regime support | Long term reversal with improving momentum | Persistent closes below the band |
📈 The primary trend has resumed, but extension risk has risen
QQQ remains in a primary uptrend because price is above a rising EMA 200 and the long term sequence still contains higher structural lows. The March low at $555.60 was followed by the July low at $661.15, while the September pullback stopped at $700.04. Each correction has ended above the previous major floor. The moving average hierarchy supports the same conclusion. EMA 12 is above EMA 26, EMA 26 is above EMA 50, and all three stand above EMA 200. That arrangement describes trend alignment rather than a temporary bounce inside a declining regime. It also explains why bearish positions require more than an overbought reading or one rejection candle.
Trend strength and entry quality are different questions. The $741.41 close is $23.63 above EMA 12, a distance of about 3.3%. It is also more than two fourteen day ATRs above that average. Strong trends can remain extended, especially when a catalyst changes expectations, but the risk reward of chasing improves only if resistance is cleared with follow through. The same move that validates the trend can reduce the margin for error. Buyers near $741 are accepting a wider stop to protect against ordinary volatility, while buyers after a controlled retest can define risk around the breakout band. The chart is bullish, but it is no longer early.
🧭 Monday’s expansion candle changed the structure
The September 21 candle did more than add 2.8% from open to close. It opened above the previous session, never traded below $727.84 and finished close to the high. That shape signals persistent demand through the session. The range measured $15.38, roughly one and a half times the current ATR of $10.11. A wide range candle that closes near its high often becomes a reference for future positioning because late buyers, early buyers and sellers all anchor to different parts of it. The upper half from approximately $735.53 to $743.22 should now attract attention. Holding there would show acceptance. A full reversal below the low would show rejection.
The expansion also broke a sequence of failed advances. QQQ reached $728.42 on August 5, $734.56 on August 17 and $724.11 on August 28, then spent most of September rotating below those highs. Monday closed above every one of them. That matters because resistance is not only a line on a chart. It represents inventory held by investors who bought near prior peaks and may sell when price returns. Clearing several peaks in one session suggests that demand absorbed a meaningful amount of supply. The remaining test is the June high, where the inventory is older and the technical significance is greater.
📊 EMA 12, EMA 26 and EMA 50 have turned into a support ladder
EMA 12 stands at $717.78, EMA 26 at $715.36 and EMA 50 at $712.33. The three averages are tightly ordered and separated by only $5.45. This creates a support ladder rather than three unrelated signals. A shallow pullback may find demand near EMA 12. A more complete momentum reset may test EMA 26 or EMA 50. As long as price forms a higher low above that cluster and the averages keep rising, the primary interpretation remains continuation. A break through all three averages would not automatically end the long term trend, but it would show that the breakout impulse has failed to attract sustained demand.
The short term spread is positive. EMA 12 is $2.43 above EMA 26, exactly matching the current MACD value because both calculations use the same underlying averages. That spread expanded sharply after Monday’s move. The signal is constructive, yet its speed argues for patience. Moving averages respond after price, so the cluster will continue rising even if QQQ pauses. Traders should therefore watch actual closes and swing structure instead of assuming that a rising average guarantees support. The averages identify zones where demand should appear. Price action must still confirm that it did.
⚡ RSI shows strength without a completed exhaustion signal
RSI 14 finished at 65.65. That is a strong reading, but it remains below the conventional 70 threshold associated with an overbought condition. More important, RSI has risen with price and did not produce an obvious bearish divergence against the August highs. Momentum is confirming the breakout attempt rather than contradicting it. A move through 70 during a close above $748.43 would be consistent with acceleration. It would not, by itself, be a sell signal. In powerful trends, RSI can remain elevated while price continues higher.
The risk appears if RSI fails near 70 while price also fails beneath the cycle high. That combination would show that momentum expanded but could not complete the breakout. A retreat toward 50 would then become a test of whether the market can reset without losing structure. The bullish reset is RSI stabilizing above roughly 50 while QQQ holds $721.86 to $734.56. The bearish reset is RSI falling below 45 as price closes beneath the fast average cluster. The indicator should be used with price location, not as an isolated command.
📉 MACD has delivered a fresh impulse
MACD closed at 2.43, above its signal line at 0.62, with a positive histogram of 1.81. The crossover followed several weeks in which momentum hovered near zero. That transition supports the idea that Monday was not merely noise inside the range. The histogram expanded at the same time price cleared the August highs, providing confirmation across price and momentum. The ideal continuation is a MACD line that keeps rising as QQQ closes above $748.43. The indicator would then show that the difference between the fast and slow averages is widening in favor of buyers.
MACD is still a lagging measure. If QQQ reverses quickly, the histogram may remain positive for several sessions while the trade has already deteriorated. The first warning would be price closing below $734.56. The next would be a histogram contraction toward zero, followed by MACD crossing back beneath its signal line. That sequence would not necessarily create a long term bear market. It would say that the breakout impulse failed and that QQQ is returning to balance. The chart then becomes a range again, with $700 to $721 as the lower decision area.
🔊 Volume improved, with one important limitation
The September 21 IEX volume reading was the largest of the month and exceeded the recent average. That increase is directionally useful because a breakout supported by more activity carries more information than a breakout on quiet participation. The volume expansion also occurred on an up candle that closed near its high, so the available evidence favors demand rather than forced liquidation. Still, IEX volume is only the activity captured on that venue. It is not a consolidated measure of all QQQ trading across United States exchanges and off exchange facilities.
For that reason, volume is supporting evidence rather than the foundation of the thesis. Price structure remains primary. If QQQ closes above $748.43 and holds the breakout, the move is valid even if venue specific volume normalizes. If price rejects the level and erases Monday’s range, high activity would not rescue the setup. The next useful comparison is whether subsequent up sessions keep producing healthy activity while pullbacks become quieter. That pattern would suggest accumulation. Heavy selling through $727.84 would suggest that the breakout invited distribution instead.
🏗️ QQQ is a concentrated growth instrument, not the Nasdaq 100 itself
Invesco describes QQQ as an exchange traded fund that tracks the Nasdaq 100, the largest nonfinancial companies listed on Nasdaq. That distinction matters. QQQ is a traded fund with its own price, volume, distributions and market microstructure. It should not be presented as the cash index. Its chart nevertheless captures the market’s pricing of a concentrated group of large growth companies, so a QQQ breakout often carries information about technology leadership, risk appetite and the willingness to pay for future earnings.
Recent leadership has again been tied to artificial intelligence enthusiasm. Reuters reported on September 22 that Meta’s new assistant helped push the Nasdaq to a record, while investors continued to weigh oil prices and geopolitics. Block2Learn’s recent analysis of AMD’s valuation milestone reached the same broader conclusion from a company perspective: strong demand can support higher prices, but margins and execution eventually determine whether the valuation survives. QQQ compresses that debate into one chart. The breakout says enthusiasm is winning now. The $748 test asks whether enthusiasm can keep winning at a prior valuation ceiling.
🏦 Rates remain the main macro counterweight
Growth assets are sensitive to interest rates because a larger share of their expected value sits in distant cash flows. A higher discount rate reduces the present value of those flows, even when the operating business remains strong. That relationship is not mechanical from day to day, but it becomes important when price is extended near resistance. Reuters reported on September 22 that Boston Fed President Susan Collins supported the recent rate increase and emphasized persistent inflation risk. Richmond Fed President Tom Barkin also argued that inflation pressure was not limited to energy and tariffs. The message is that policy can remain restrictive even while the economy is firm.
This is the macro reason not to treat a technical breakout as inevitable. QQQ can advance despite higher rates if earnings expectations improve faster than discount rates, or if leadership becomes narrow and powerful enough to dominate the index. But a renewed rise in Treasury yields can increase volatility and punish the most expensive constituents. The recent Block2Learn newsletter on oil and yields framed the same tension across risk assets. On the QQQ chart, the practical translation is simple: above $748.43, price is proving that demand can absorb the macro headwind. Below $721.86, the headwind is gaining influence.
🟢 Bullish scenario: acceptance above $748.43
The bullish scenario requires a completed daily close above $748.43. The best version is not a vertical sprint that immediately becomes unstable. It is a controlled breakout, followed by one or more sessions holding above roughly $741. Price may briefly return below $748 during a retest, but it should avoid a completed close beneath $734.56. RSI can move into the low 70s, while MACD remains above its signal line. Under those conditions, the former ceiling becomes a base and the next objectives are $760, then the $768 to $775 region created by measured extensions of the summer range.
An educational long setup can be structured around confirmation rather than prediction. One approach waits for a close above $748.43 and then looks for a retest that holds. The confirmation is a higher low followed by renewed strength through the retest high. The invalidation is a completed close below $734.56, or a faster exit if the breakout candle is fully erased. The advantage is that the market proves acceptance first. The cost is a later entry and a wider distance from lower support. Position sizing must reflect the roughly $10 daily ATR, because normal QQQ movement can be large even when the thesis remains intact.
🟡 Neutral scenario: a high level range
The neutral scenario is a consolidation between roughly $721.86 and $748.43. Price could spend days rotating inside that band while the fast averages rise beneath it. This outcome would relieve extension without damaging the trend. RSI would likely oscillate between the high 40s and high 60s, while MACD flattens but remains near or above zero. A high level range after a strong candle often represents digestion, not indecision. The key is whether pullbacks remain shallow and whether closes cluster in the upper half of the structure.
For swing traders, the neutral range offers two different approaches. Momentum traders can wait for the boundary break. Mean reversion traders can work from the edges, but only with tighter risk and smaller expectations. A long near $722 requires evidence that buyers are defending the breakout base. A short near $748 requires a clear rejection and must respect the primary uptrend. The middle of the range offers poor asymmetry because price can move in either direction before reaching a meaningful level. Patience is part of the setup, especially after a wide expansion candle.
🔴 Bearish scenario: breakout failure below $721.86
The bearish scenario begins with rejection near $748 and becomes credible after a completed close below $734.56. It strengthens below $727.84 because that level marks the low of Monday’s expansion candle. The decisive confirmation is acceptance below $721.86, which would place QQQ back inside the September range and undermine the breakout narrative. RSI should fall below 50, while the MACD histogram contracts. The first downside objectives are the EMA cluster between $712 and $718, then the September floor between $700.04 and $704.68.
An educational short setup should not begin merely because QQQ touches resistance. The primary trend is rising, so the short needs evidence of failure. A cleaner trigger is a bearish rejection followed by a close below $727.84, with risk defined above the failed rebound high. The first target is $721.86, followed by the moving average cluster. The position loses its rationale if QQQ quickly reclaims $734.56 and closes above it. A deeper bearish thesis does not become valid until $700 breaks. Below that point, $686.78 and the EMA 200 near $669.47 become relevant.
🧪 What would invalidate the bullish base case
The Block2Learn base case is bullish continuation after consolidation, with an estimated probability of 55%. Neutral consolidation receives 30%, while a bearish failure receives 15%. These are scenario weights, not forecasts with guaranteed precision. The bullish edge comes from trend alignment, the break above August highs, rising momentum and the strong close. The restraint comes from the June high overhead, short term extension and restrictive rate risk. A clean close above $748.43 would increase the bullish weight. A close below $721.86 would reduce it sharply.
The base case is invalidated if QQQ cannot hold the breakout base. A single intraday dip is insufficient because the daily ATR is above $10. The important evidence is a completed close below $721.86, followed by failure to reclaim that level. A second invalidation is momentum deterioration that becomes visible before the price break, such as RSI falling below 50 and MACD turning down while rallies stall beneath $734.56. The strongest invalidation is a close below $700, which would break the September floor and turn the current move into a failed expansion rather than a healthy retest.
🧠 How to read the live candle
The current session can move above or below the completed levels without changing the daily conclusion. During United States trading hours, the daily candle is still forming. Its high, low and close can change materially before the market closes. A print above $748.43 is therefore an alert, not a confirmed breakout. The confirmation arrives only when the completed daily bar preserves the move. The same rule applies below support. An intraday drop through $734.56 may reverse before the close and leave a constructive lower wick.
This distinction is especially important after Monday’s wide range. Short term order flow can produce sharp swings as traders take profit, options hedges adjust and new buyers test liquidity near the old high. The chart should be judged by acceptance. Repeated trade near a level, stable closes and successful retests show acceptance. Fast reversals show rejection. The live widget above is useful for monitoring the developing structure, while the static snapshot preserves the last completed evidence used for the scenario map.
🗺️ Learning Path
First, identify the regime before choosing a trade direction. QQQ is above a rising EMA 200, so the default regime is bullish. Second, separate the breakout gate at $748.43 from support at $734.56 and $721.86. Third, use RSI and MACD to confirm or question what price is doing, rather than treating them as independent signals. Fourth, size risk using ATR. With ATR near $10.11, a stop placed only one or two dollars away can be triggered by ordinary noise. Fifth, wait for a completed candle when the thesis depends on a daily close.
Readers who want to compare an index linked ETF with a broader market instrument can revisit the SPY technical analysis. The contrast is useful because SPY was testing a fast average cluster, while QQQ is testing a cycle high after a stronger momentum burst. The recent analysis of AI shopping agents and payment liability adds another layer: technology leadership is expanding into commerce, but new revenue channels bring new operational risk. Together, the pieces show why price can be bullish while fundamental uncertainty remains real.
🎯 Final outlook
QQQ has earned a bullish interpretation, but it has not yet earned a breakout above the 2026 cycle high. The September 21 close cleared the August peaks, restored positive short term momentum and placed every major moving average beneath price. RSI and MACD confirm the impulse. The immediate task is now more demanding: buyers must absorb $748.43 and hold the former resistance band as support. If they do, $760 and the upper $760s become reasonable objectives. If they fail but preserve $721.86, the chart can consolidate without losing its primary trend.
The line between a healthy retest and a failed breakout is $721.86, with $700 as the deeper structural floor. Above those levels, weakness can remain a reset inside an uptrend. Below them, the market must rebuild. The most useful stance is therefore conditional rather than emotional. Respect the strength, avoid chasing an unconfirmed high and let completed closes decide whether QQQ is beginning a new leg or returning to the range it just escaped.
This article is provided solely for informational and educational purposes and does not constitute financial or investment advice, a recommendation, or an offer or solicitation to buy or sell any financial instrument or digital asset. See our Financial Disclaimer.
This article was generated with the support of AI and reviewed by the Editorial Team. For more information, see our Terms of Service.