




SPY technical analysis is testing whether the September rally can survive a loss of short-term momentum without losing its longer-term trend. The latest completed SPDR S&P 500 ETF Trust daily candle, dated September 18, opened at $761.30, reached $762.00, traded down to $757.98 and closed at $761.62. That close left SPY almost exactly on its fast trend cluster: EMA 12 finished at $761.99 and EMA 26 at $762.60. RSI 14 ended at 49.15, while MACD remained below its signal line. The immediate structure is therefore neutral rather than broken. Price is no longer accelerating, but it still stands 5.8% above the rising EMA 200 at $719.86. The decision corridor runs from the $749.68–$756.64 support band to the $774–$779 resistance shelf. A completed close outside that corridor would carry more information than any intraday move inside it.
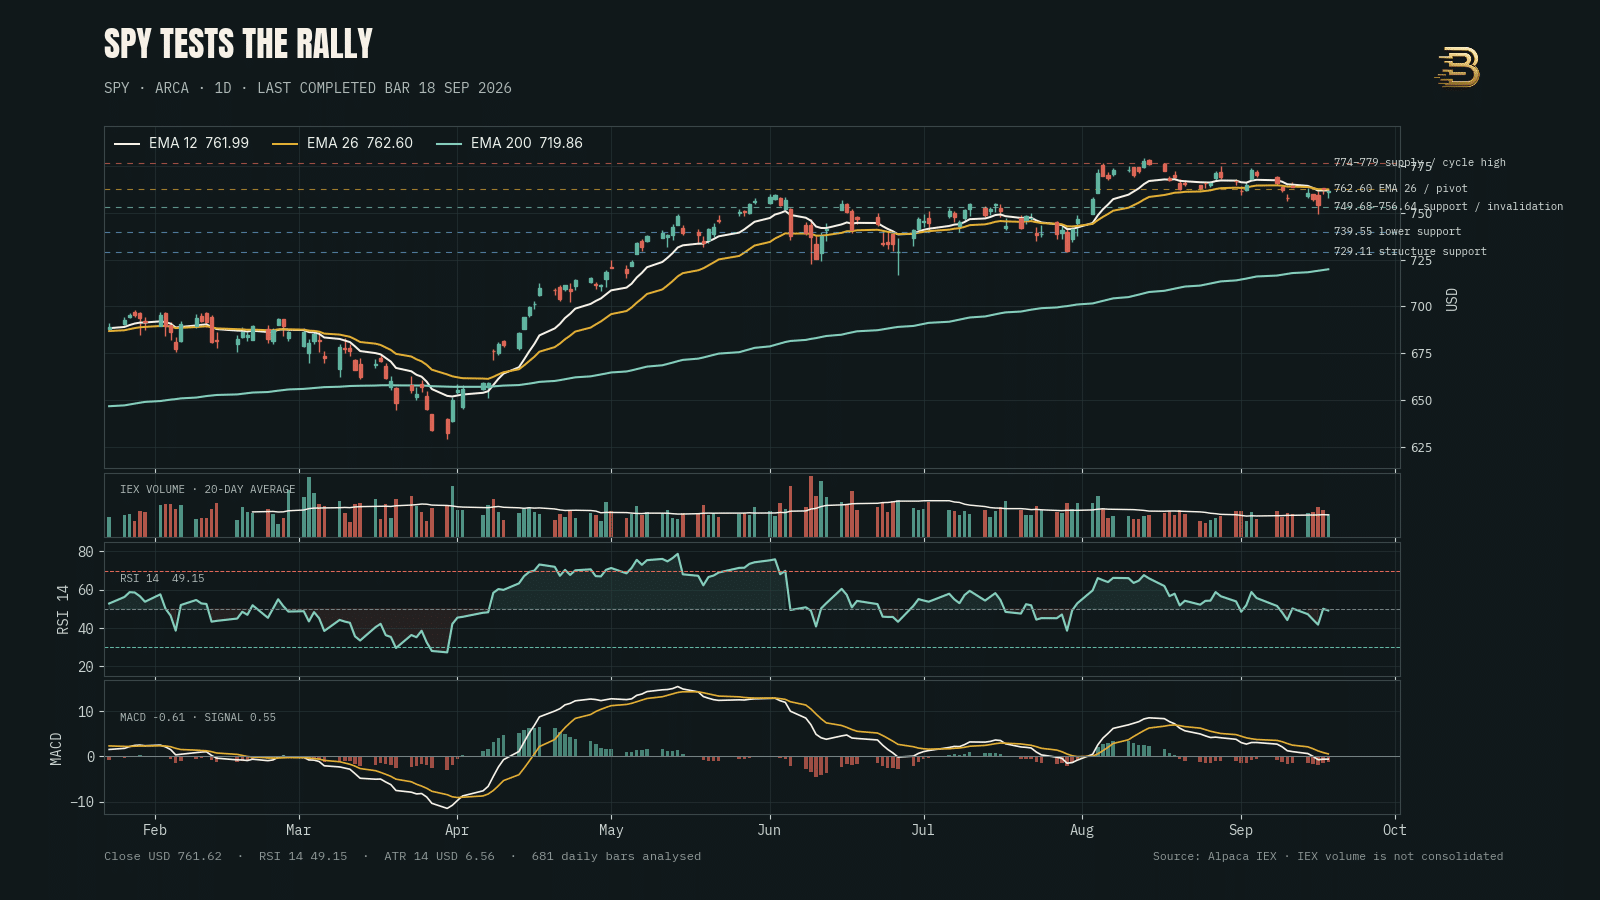
The chart is caught between two valid stories. Bulls can point to the March–August recovery, the rising EMA 200 and repeated defenses of the mid-$750s. Bears can point to the failed August breakout, price below EMA 12 and EMA 26, an RSI below 50 and a negative MACD histogram. Neither side has completed the move it needs. A reclaim of $766 followed by acceptance above $774 would rebuild upside momentum. A completed close below $749.68 would break the most important September reaction low and expose lower support near $739.55 and $729.11. Until one of those conditions occurs, SPY is consolidating within a primary uptrend rather than confirming either a fresh breakout or a trend reversal.

🔍 The levels that define the SPY decision
The first resistance is the $762–$766 band. EMA 12 and EMA 26 sit at $761.99 and $762.60, and several September candles closed or reversed in this area. It is not a major ceiling by itself, but it is the immediate momentum gate. SPY needs to spend time above it before buyers can challenge the stronger supply between $774 and $779.37. A single close at $763 would improve the tape; repeated closes above $766 would show that the short-term averages are becoming support again.
The primary resistance zone extends from the September 3 high at $774.02 through the August 13 cycle high at $779.37. August produced several failures inside this area, including highs at $776.81, $775.03, $778.78 and $779.37. That cluster matters more than a round number because it records repeated supply across multiple sessions. A brief move above $774 is therefore only a test. Confirmation requires a completed close above $779.37, preferably followed by a retest that holds the lower part of the zone.
Support begins at $756.64, the September 10 low, and extends to $749.68, the September 16 low. That lower print formed during a wide session, yet SPY recovered to close at $754.05 and then rebounded to $762.64 the following day. Buyers have already demonstrated interest there once. A second test would be more demanding because repeated contact consumes resting demand. Below $749.68, the next references are $739.55 from July 8, $729.11 from July 29 and the EMA 200 near $719.86.
| Zone | Technical role | Confirmation | Invalidation |
|---|---|---|---|
| $774–$779.37 | Primary supply and breakout gate | Daily close above $779.37, then a successful retest | Rejection followed by loss of $756.64 |
| $762–$766 | EMA 12/26 momentum pivot | Repeated closes above $766 | Failure back below $756.64 |
| $756.64–$749.68 | September support and immediate invalidation | Higher low and reclaim of $762.60 | Completed close below $749.68 |
| $739.55–$729.11 | Summer structure support | Fast defense and close above $749.68 | Acceptance below $729.11 |
| $719.86–$716.58 | EMA 200 and June regime band | Long-term reversal with improving breadth | Persistent closes below $716.58 |
📈 The primary trend is still higher
SPY’s long-term trend remains constructive because price is above a rising EMA 200. The September 18 close is $41.76 above the average, a distance of 5.8%. That cushion matters. Short-term momentum can weaken for days or weeks without immediately changing the broader regime. The March low at $629.29, the June low at $716.58 and the late-July low at $729.11 form a sequence of progressively higher structural lows. The market has not yet violated that sequence.
The same trend is mature enough to deserve caution. SPY traveled from $629.29 in late March to $779.37 in August, a gain of almost 24% in less than five months. The advance accelerated sharply from the June base and left the EMA 200 far below price. A rising long-term average is bullish evidence, but a wide distance from it can also indicate that the market has already priced substantial optimism. A mature trend can continue, yet entries near resistance require stronger confirmation than entries near the beginning of an advance.
The most useful distinction is between trend direction and momentum direction. Trend direction is still positive because the 200-day average is rising and the major lows are higher. Momentum direction is neutral to negative because price is slightly below the fast averages, RSI has slipped below 50 and MACD is under its signal line. Those conditions can coexist. They describe a long-term uptrend undergoing a short-term test. The next break from the $750–$779 corridor will reveal whether the test becomes a continuation base or a deeper correction.
🧭 The September pullback is a test of acceptance
The August high did not produce clean price discovery. SPY reached $779.37 on August 13, then fell to $762.07 by August 20. The rebound that followed stopped at $775.29 on August 28, below the cycle high. September opened with another decline to $759.49, followed by a sharp rebound to $774.02 on September 3. That second failure established a pattern of lower highs beneath a horizontal ceiling. It does not prove distribution, but it shows that buyers have not absorbed supply.
The decline from September 3 to September 16 was orderly rather than panicked. Price lost the fast averages, reached $749.68 and then recovered immediately. The September 17 rebound closed at $762.64, almost exactly on EMA 26, while the September 18 candle held most of that recovery. This sequence looks like an attempted support defense. It becomes meaningful only if SPY can move above $766 and prevent the fast averages from turning down more decisively.
Acceptance is the key concept. Markets often penetrate a level briefly because stops, options hedging and short-term orders concentrate around obvious references. A wick is contact; acceptance is sustained trade and completed closes beyond the boundary. Bulls need acceptance above $779.37. Bears need acceptance below $749.68, then below $729.11. Inside those points, movement can be significant without resolving the chart. That framework reduces the temptation to convert every volatile session into a new long-term forecast.
📊 EMA 12 and EMA 26 have converged into a momentum hinge
EMA 12 stands at $761.99 and EMA 26 at $762.60. Their separation is only $0.61, less than one tenth of one percent of price. That convergence reflects a market whose recent direction has flattened. The faster average has moved below the slower one, a mild bearish condition, but the gap is too small to treat as a durable trend signal. A few strong closes can reverse it quickly. The cluster is best used as a hinge: above it, momentum improves; below it, pressure remains.
The last close at $761.62 is $0.37 below EMA 12 and $0.98 below EMA 26. These distances are negligible relative to the fourteen-day ATR of $6.56. SPY is not extended beneath the averages; it is sitting directly on them. That location raises the value of follow-through. A close above $766 with a higher high would show that the September rebound is gaining traction. A move below $756.64 would show that the rebound failed before clearing its first technical barrier.
EMA 200 tells a different story. At $719.86, it remains well below price and continues to rise. If SPY breaks $749.68, the long-term trend would not instantly turn bearish. The market would first test intermediate supports at $739.55 and $729.11. Only sustained trade near or below the EMA 200 would challenge the primary regime. The moving-average hierarchy therefore separates tactical weakness from strategic damage: the fast cluster governs the next move, while EMA 200 governs the larger one.
⚡ RSI has returned to the middle of the range
RSI 14 closed at 49.15. That reading is almost perfectly neutral and carries none of the urgency associated with overbought or oversold conditions. Momentum is no longer supporting the rally, but it is not deeply washed out either. RSI in the high 40s often appears during consolidations, especially when price is rotating around short-term averages. The next useful signal would be a move above 55 during a reclaim of $766 or a move below 40 during a loss of $749.68.
The August advance pushed RSI into the upper 60s, while the September pullback brought it back toward the center. That reset can be healthy if price preserves support. A market that works off momentum without giving back much price is often building a base. The bearish alternative is momentum deterioration ahead of price: RSI remains below 50, rallies fail to reach prior momentum peaks and support is tested repeatedly. The September chart has not completed either pattern.
RSI should be read with location. A reading of 49 near the EMA 200 would describe a different risk profile than 49 near the upper end of a five-month advance. SPY remains relatively close to resistance and far above its long-term average, so neutral momentum does not automatically create a favorable entry. It creates a waiting zone. Bulls want RSI to regain 55–60 as price moves above $766. Bears want a break below 40 as price closes beneath $749.68.
🌊 MACD shows deceleration, not collapse
MACD is -0.61 and its signal line is 0.55, leaving a histogram of -1.16. The indicator has crossed below zero and below its signal, confirming that short-term momentum weakened after the August peak. The negative histogram has persisted through much of September, but it has become less negative since the September 16 low. That improvement is consistent with stabilization. It is not yet a bullish reversal because the MACD line itself remains below the signal line.
A constructive sequence would involve price holding above $756.64 while the histogram continues to contract toward zero. A bullish crossover near the zero line, combined with a close above $766, would show that momentum is turning before SPY reaches the major ceiling. That setup would improve the probability of another $774–$779 test. A crossover that occurs only after price has already reached resistance would offer less useful information because the market would have spent much of the move before the signal arrived.
The bearish sequence would be a new histogram low while price closes below $749.68. That combination would show that the support break is accompanied by accelerating downside momentum rather than a single volatile session. Indicators are secondary to price, but alignment matters. A level failure with weak momentum can reverse quickly; a level failure with expanding momentum is more likely to produce continuation toward $739.55 and $729.11.
🔊 Volume confirms participation only within the IEX feed
The September 18 candle traded 1.29 million shares in Alpaca’s IEX feed, 1.04 times the twenty-day average of 1.25 million. The September 16 support test traded 1.68 million, while the September 17 rebound traded 1.52 million. Within this feed, both the selloff and the recovery attracted above-average participation. That balance supports the idea that the market is negotiating a genuine decision zone rather than drifting through an empty range.
IEX volume is not consolidated U.S. exchange volume, so absolute totals should not be compared with full-market figures from other providers. The coherent use is internal: compare IEX sessions with the IEX average. On that basis, the September 18 pause was normal rather than exceptionally quiet or heavy. A breakout above $779.37 would be more credible if IEX activity expands above its recent mean. A breakdown below $749.68 would be more threatening under the same condition.
Volume is most informative when it supports the closing location. High turnover with a close near the top of the daily range suggests buyers absorbed supply. High turnover with a close near the low suggests sellers controlled the session. September 16 recovered substantially from its $749.68 low, while September 17 closed near its high. That two-day pattern supports demand at the lower edge of the corridor. Bulls still need to prove that demand can survive the trip back into overhead supply.
🌡️ ATR makes the corridor tradable but noisy
Average True Range over fourteen completed sessions is $6.56, or roughly 0.86% of the last close. One ATR above $761.62 reaches about $768.18; one ATR below reaches about $755.06. This places the first support and momentum gates inside normal daily movement. A session can touch $756 or $768 without delivering an unusual volatility event. That is why completed closes and follow-through are more reliable than intraday contact.
The entire $749.68–$779.37 corridor spans about 4.5 ATR. It is wide enough to support tactical swings but narrow enough that price can cross it in several strong sessions. A breakout trader who enters on the first tick above $779.37 could be exposed to a routine reversal back into the zone. A support trader who treats $756.64 as an exact floor could be stopped by normal noise. Zones and closing evidence are better suited to the measured volatility.
ATR also disciplines position sizing. If a setup requires invalidation beneath $749.68 from an entry near $763, the structural risk is more than two ATR. Reducing the stop to a few dollars would change the thesis from structural to intraday. The coherent sequence is to define invalidation from the chart, calculate the distance and then size the position. Volatility should determine exposure, not be ignored to preserve a preferred share count.
🧩 The pattern is a broad range beneath a failed breakout
The current pattern is not a clean triangle or textbook flag. SPY has formed a broad range with repeated highs in the $774–$779 area and reactive lows that have moved from $762 to $759, then to $749.68. The upper boundary is clear, while the lower boundary is less stable. That asymmetry creates a slight bearish tilt inside an otherwise bullish long-term trend. Buyers keep returning, but they have needed lower prices to do so.
The bullish interpretation is reaccumulation. The March–August rally generated substantial gains, and the market is now absorbing profit-taking while the EMA 200 catches up. Under this reading, the fast averages flatten, RSI resets and SPY eventually reclaims $766 before breaking $779.37. The bearish interpretation is distribution. Repeated resistance tests allow large holders to sell into strength, while each support response begins from a lower level. Under that reading, $749.68 eventually fails.
The next reaction will separate the narratives. A higher low above $756.64 followed by a close above $766 would interrupt the pattern of lower reaction highs and lows. A lower high beneath $766 followed by a close below $749.68 would extend it. Both outcomes are observable. Neither requires predicting the next macro headline. The chart provides a decision tree: respect the range until price proves it has left.
🟢 Bullish scenario: reclaim $766, then clear $779.37
The bullish scenario begins with repeated closes above $766. That would place SPY back above EMA 12 and EMA 26, turn the fast cluster into support and push RSI toward the mid-50s. The next objective is $774.02, followed by the $779.37 cycle high. The breakout is confirmed only by a completed close above $779.37. An intraday high beyond it without a strong close would repeat the August problem rather than solve it.
After confirmation, the quality of the retest becomes decisive. A pullback that holds $774–$779 would indicate that former supply has become demand. The first measured objective would be near $790, followed by the psychological $800 level. A stronger extension could reach $808–$812, approximately the height of the latest upper range projected above the breakout. These are conditional map points, not guaranteed targets.
The bullish thesis weakens if SPY reclaims $766 but fails again below $774. It is invalidated more clearly if that failure is followed by a completed close below $756.64. A close below $749.68 would convert a failed breakout attempt into a structural warning. The best bullish version therefore combines price, momentum and participation: close above resistance, RSI above 55, MACD turning higher and volume expanding relative to the IEX average.
🟡 Neutral scenario: rotation between support and supply
The neutral scenario is continued movement between $749.68 and $779.37. SPY could spend several weeks rotating within this corridor while the EMA 200 rises and the fast averages flatten. This would not be unusual after a strong five-month advance. Time can correct excess without a large decline. The longer price holds above $749.68, the more opportunity buyers have to rebuild momentum without surrendering the larger trend.
A healthy neutral range would show higher lows above $756.64, RSI oscillating around 50 and MACD moving toward zero. Volume would contract during pullbacks and expand during advances. A defensive range would show lower highs beneath $766, repeated tests of $749.68 and heavier activity on down sessions. Both structures can exist inside the same horizontal boundaries, which is why internal behavior matters more than the simple label “range.”
The neutral thesis is useful because incomplete evidence is common. Traders do not need to force a directional position while price is between confirmation and invalidation. A range can reward short-duration strategies, but those require different risk controls from trend positions. The daily chart remains most informative at its edges. Inside the middle, the signal-to-noise ratio falls and the value of patience rises.
🔴 Bearish scenario: acceptance below $749.68
The bearish scenario requires a completed close below $749.68. That would break the September reaction low, confirm that the rebound through $762.64 failed and shift attention to $739.55. If SPY cannot reclaim $749.68 on the next rebound, the support break would become acceptance rather than a temporary flush. RSI below 40 and an expanding negative MACD histogram would add momentum confirmation.
Below $739.55, the next structural band is $729.11–$716.58. The upper edge is the late-July pivot low; the lower edge is the June swing low, with EMA 200 currently at $719.86 inside the zone. This is the primary long-term regime test. Buyers should respond there if the March–August uptrend remains intact. A weak bounce that fails below $739.55 would increase the probability of deeper damage.
Acceptance below $716.58 would break the sequence of higher major lows and place SPY beneath EMA 200. The next references would be near $700 and the May support region around $690–$694. The bearish thesis is invalidated if a break below $749.68 is quickly reclaimed and followed by a close above $762.60. Failed breakdowns can reverse sharply because short sellers cover while sidelined buyers recognize that support has returned.
🎯 Potential long structures
A confirmation-based long structure would wait for a completed close above $779.37 and then evaluate the retest. Its advantage is clarity: the market has already broken the range. Its disadvantage is a higher entry and larger distance to structural invalidation. The premise fails if price closes back below $774 and cannot recover. This approach pays a higher price for better information.
A support-based long structure would focus on a reversal inside $756.64–$749.68. The setup would need evidence: a lower wick, a strong close, RSI stabilizing near or above 45 and a subsequent reclaim of $762.60. Simply touching support is not enough. The advantage is closer invalidation beneath $749.68. The disadvantage is that the market remains below resistance and may continue ranging.
A deeper regime long would consider the $729.11–$716.58 band only if SPY reaches it in an orderly way and then reclaims EMA 200. That is a different thesis from the immediate September support trade. It assumes the primary uptrend survives a medium-term correction. Because volatility could expand during such a decline, position size would need to contract. Mixing a breakout thesis with a mean-reversion entry creates incoherent risk.
🎯 Potential short structures
A rejection-based short structure would require a failed move into $774–$779, followed by a close below $766 and weakening RSI. The first objective would be $756.64, then $749.68. The risk is substantial because the position fades a rising long-term trend before primary support has failed. Resistance is a location, not a signal; the reversal pattern provides the evidence.
A breakdown-based short structure would wait for a completed close below $749.68 and a failed reclaim. The first objective is $739.55, followed by $729.11 and EMA 200 near $719.86. The advantage is stronger confirmation. The disadvantage is reduced distance to support and the possibility of a bear trap. A close back above $762.60 would undermine the premise.
Both structures must account for a $6.56 ATR and event-driven gaps. SPY can open beyond a planned stop after macro news, geopolitical escalation or a sharp move in Treasury yields. Options hedging can amplify movement near widely watched strikes. A technically correct level does not remove execution risk. The educational framework is to define confirmation, invalidation and position size before the market reaches the trigger.
🌐 Macro pressure is concentrated in yields and oil
The latest market context explains why SPY can hold near its highs while momentum deteriorates. On September 18, the S&P 500 rose 0.2%, but the majority of U.S. stocks declined as the 10-year Treasury yield returned to 5%. The Associated Press reported that elevated yields and volatile oil prices weighed on the market, even as the headline index finished slightly higher. That divergence is consistent with a narrow, fragile tape rather than a clean risk-on impulse.
The Federal Reserve had raised its target range earlier in the week, and officials indicated that further tightening could remain necessary. The September 16 FOMC statement matters technically because higher rates raise the discount rate applied to future cash flows and increase the opportunity cost of holding equities. A break above $779.37 would show that SPY is absorbing that pressure. A break below $749.68 would show that the pressure is reaching price.
Oil adds a second channel. Rising energy costs can lift inflation expectations, squeeze consumer budgets and pressure corporate margins. The recent Block2Learn analysis of Russian refinery disruption and global inflation mapped how refined-product scarcity can travel through transport and pricing. The chart does not need to predict the oil path. It needs to show whether equity buyers can defend support while that uncertainty remains.
🧭 The Block2Learn base case
The Block2Learn base case is neutral-to-constructive consolidation above $749.68, with a modest probability advantage for another test of $774–$779 before a full EMA 200 retest. The primary trend is still higher, price remains well above EMA 200 and the September support response was immediate. Those factors argue against treating the current weakness as a confirmed reversal.
The edge is limited because short-term evidence is not bullish. Price is below EMA 12 and EMA 26, RSI is 49.15 and MACD remains negative relative to its signal line. The latest Block2Learn newsletter described the same broader tension: a calm headline index can conceal weakening leadership. SPY’s chart reflects that tension. Stability at the index level is not the same as expanding participation.
The base case upgrades to bullish on a close above $779.37 and successful retest. It downgrades to defensive on a close below $749.68. Acceptance below $729.11 shifts the probability toward an EMA 200 test, while acceptance below $716.58 changes the primary regime. This hierarchy prevents one ordinary session from causing an emotional change in thesis. Evidence updates the map; headlines do not replace it.
⚖️ Data integrity, risk and uncertainty
This analysis uses 681 completed SPY daily bars from Alpaca’s IEX feed, beginning January 2, 2024 and ending September 18, 2026. The U.S. cash market was closed at the analysis time, so there was no incomplete September 20 daily candle to separate. All moving averages, RSI, MACD, ATR, returns and levels are calculated from completed bars. The latest OHLC is $761.30, $762.00, $757.98 and $761.62.
IEX volume is not consolidated exchange volume. It is used consistently within one coherent series for relative comparisons, not represented as total U.S. market activity. The official State Street SPY page establishes the instrument and its objective, while Alpaca supplies the historical OHLCV used for this chart. Different feeds can show small differences in highs, lows, VWAP and volume.
The principal uncertainty is macro gap risk. Treasury yields, oil prices, central-bank communication and geopolitical headlines can move index products before the regular session opens. A planned invalidation may therefore execute at a worse price than the chart implies. Correlation is another risk: SPY can appear stable while sectors and individual stocks diverge sharply. The NVIDIA duration analysis showed how concentrated leadership can transmit valuation sensitivity into the index.
🔮 Final outlook
SPY is not in a confirmed breakdown. It is testing whether a powerful five-month advance can absorb a loss of momentum near the top of its range. The September 18 close at $761.62 sits almost exactly on EMA 12 and EMA 26, while RSI 14 is neutral at 49.15. MACD remains weak, but the long-term trend is protected by a rising EMA 200 at $719.86. That combination supports patience rather than conviction.
The map is clear. Above $766, momentum improves. Above $779.37, the breakout is confirmed and $790–$800 becomes active. Below $756.64, the support test deepens. Below $749.68, the immediate structure breaks and $739.55–$729.11 becomes the next decision band. Acceptance below $716.58 would damage the primary uptrend. Between those levels, SPY remains a range-bound index with strong long-term structure and incomplete short-term evidence.
Readers who want to turn this framework into a repeatable process can continue through the Block2Learn Learning Path. The method is portable: use completed data, separate trend from momentum, measure volatility, define confirmation and invalidation, and update the base case only when price, participation and momentum align.
Learn continuously. Build deliberately.
This article is provided solely for informational and educational purposes and does not constitute financial or investment advice, a recommendation, or an offer or solicitation to buy or sell any financial instrument or digital asset. See our Financial Disclaimer.
This article was generated with the support of AI and reviewed by the Editorial Team. For more information, see our Terms of Service.


