





NVIDIA has rebounded from the 208 dollar support area, but the recovery is now pressing into a much more demanding decision zone. The shares traded near 218.9 dollars during the open United States session on September 17, recovering above the 20 day and 50 day exponential moving averages after the sharp retreat from the September high near 234.75 dollars. That improvement matters because buyers defended the first major support cluster and rebuilt short term structure. It is not yet a confirmed breakout. The 220 area is the first pivot, 228 is the first serious resistance, and the 234 to 236 region remains the ceiling that has rejected the market twice since May. NVIDIA is therefore no longer sitting at the point of maximum downside pressure, but it is still trading inside a range where every rally must prove that demand can absorb supply left by the latest failed high.
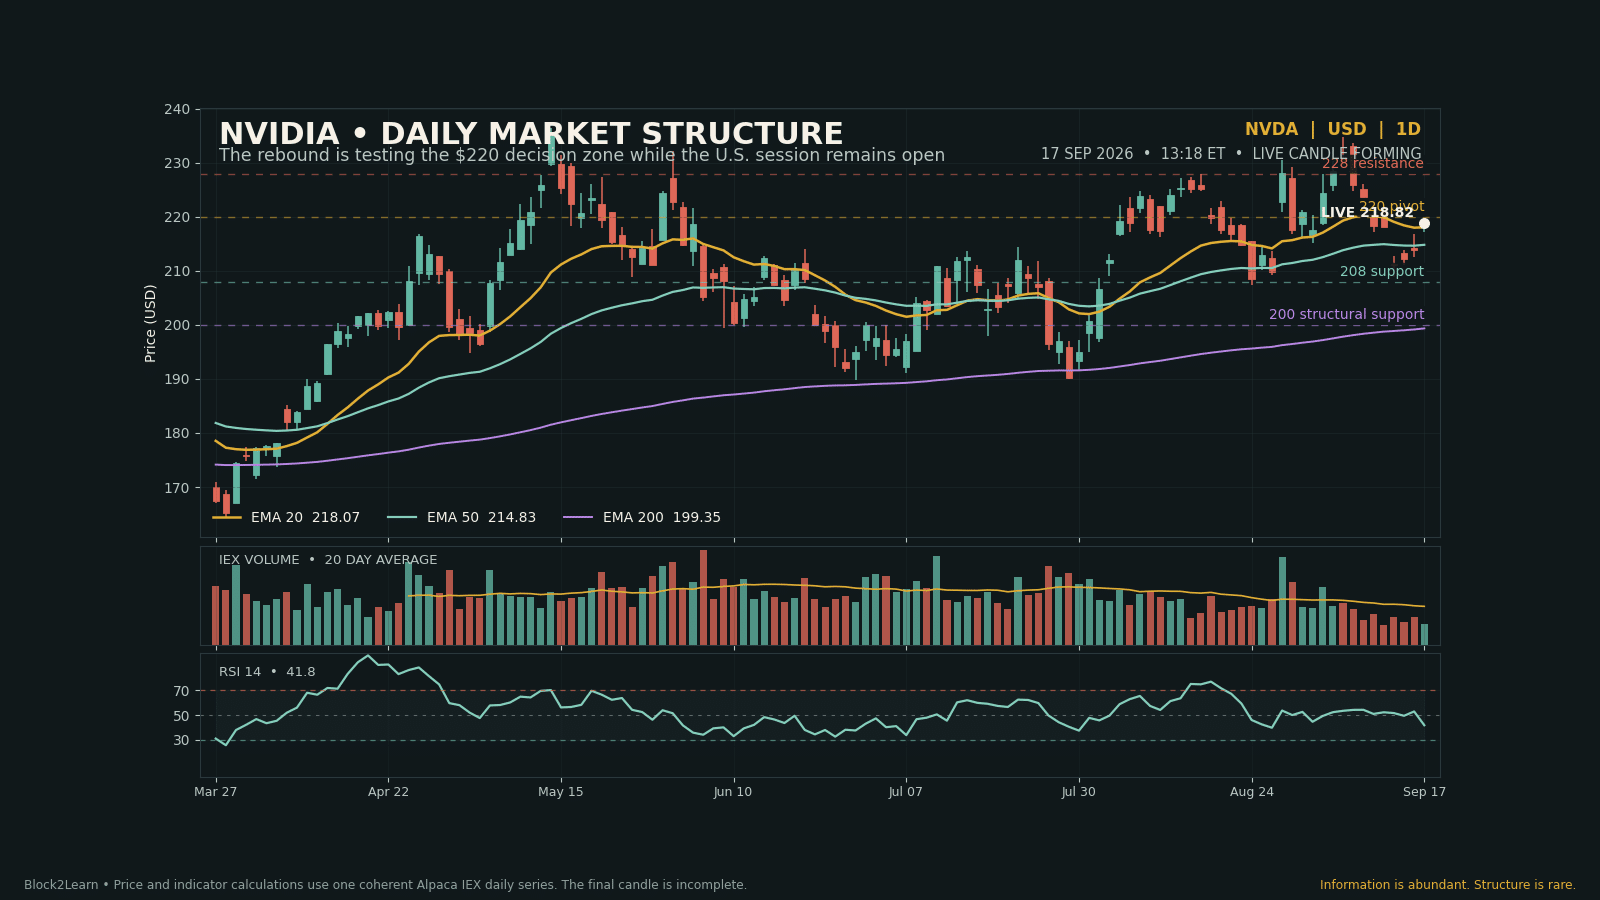
The daily trend remains constructive on the broad horizon because price is above a rising 50 day EMA near 214.83 dollars and a rising 200 day EMA near 199.35 dollars. The tactical picture is less settled. RSI remains near 41.8, the MACD histogram is negative, and the current candle has not closed. The rebound is occurring after three completed sessions of stabilization rather than after a decisive washout. That combination produces a clear technical question. If NVIDIA can convert 220 into support and then close above 228 with stronger participation, the market can challenge the 234 to 236 ceiling again. If the rebound fails below 220 or 228, sellers can force another test of 214, 208, and eventually the psychologically important 200 area.

🧭 The Daily Structure Is Bullish, but the Range Still Controls Price
The most important distinction in the NVIDIA chart is the difference between trend and location. The broader trend is still positive. Over the last several months the shares have held above the 200 day EMA, produced repeated rebounds from the 190 to 200 region, and preserved a sequence of major lows that remains higher than the spring base. The 50 day EMA has continued to rise, which indicates that the medium term average price paid by the market is moving higher rather than rolling over. Those conditions make it premature to describe the chart as structurally bearish.
Location, however, is much less comfortable. NVIDIA is trading in the middle of a wide range bounded by support around 200 to 208 and resistance around 228 to 236. A trader buying near the center of that range receives less favorable asymmetry than a trader responding to a confirmed support test or a verified breakout. Price can travel several percentage points in either direction without changing the larger structure. That is why the 220 pivot matters. It is not a magical price. It is the area where the rebound begins to encounter the lower edge of the supply created during the September decline.
The range also contains two important failed advances. NVIDIA reached approximately 236.54 dollars in May and 234.75 dollars in early September. The second attempt did not extend the first high. Instead, price reversed toward 208.94 dollars over the following sessions. That sequence resembles a broad double rejection, although it is not a completed double top because neckline support has not broken. A bearish pattern requires confirmation, and the 208 to 200 zone has not provided it. The correct interpretation is therefore conditional. Repeated resistance exists near 235, while medium term support remains intact.
📍 Four Levels Define the Next Directional Move
| Level | Technical role | What confirmation would mean |
|---|---|---|
| 234 to 236 dollars | Major range ceiling and repeated swing high | A daily close above this band would confirm range expansion and restore price discovery. |
| 228 dollars | First major resistance after the rebound | A close above 228 with improving volume would weaken the lower high thesis. |
| 220 dollars | Immediate pivot near the current rebound | Holding above 220 would show that buyers can retain control above the short term averages. |
| 208 to 200 dollars | Primary support cluster and structural invalidation zone | Losing 208 would expose the 200 day EMA; losing 200 would materially damage the medium term trend. |
The 220 pivot is the first gate because it sits just above the current intraday price and close to the short term balance point. A single move through 220 is not enough. NVIDIA briefly traded through nearby levels several times during the recent range, so confirmation requires a completed daily close and evidence that the level holds on a retest. A close above 220 followed by a shallow pullback would tell us that supply is being absorbed rather than merely touched.
The 228 level is more consequential. It was part of the late August breakout area and sits below the early September high. Price reaching 228 would not yet establish a new high, but it would recover most of the recent decline and place the market back inside the upper part of the range. The reaction there would reveal whether the 234 to 236 ceiling is still distributing shares or whether the September pullback has reset momentum sufficiently for another challenge.
Support begins near the 50 day EMA around 214.83 dollars. This moving average is close to the previous completed close and to the consolidation built between September 15 and September 16. Below it, 208 is the visible swing support that stopped the decline. The 200 area combines a round number, the rising 200 day EMA, and a previous July balance region. The more technical features converge around a zone, the more closely the reaction should be observed. Confluence does not guarantee a bounce, but it helps explain why liquidity may concentrate there.
📈 The Moving Averages Still Favor Buyers
NVIDIA is currently trading slightly above the 20 day EMA near 218.07 dollars, above the 50 day EMA near 214.83 dollars, and well above the 200 day EMA near 199.35 dollars. The ordering remains constructive because the faster averages are above the slower average. The 50 day EMA also sits more than 15 dollars above the 200 day EMA. That separation reflects the strong advance from the summer lows and confirms that the medium term trend has not yet rolled into a classical bearish alignment.
The 20 day EMA is nearly flat, however, and the live price is only marginally above it. This is a tactical warning. When price is far above a rising short term average, momentum is usually obvious. When price repeatedly crosses a flattening average, the market is searching for equilibrium. NVIDIA is in the second condition. The 20 day EMA is functioning as a pivot rather than as dynamic support. Buyers need several closes above it to turn the average upward and reestablish positive short term slope.
The 50 day EMA offers a more durable test. NVIDIA closed near 211 dollars on September 14, temporarily below that average, then recovered over the next sessions. That is an early sign of demand. The signal becomes stronger if the shares remain above the average during the next pullback. It becomes weaker if price closes below 214 and cannot reclaim it quickly. In other words, the 50 day EMA is not valuable because it predicts the future. It is valuable because the market has already reacted around it and can now reveal whether that reaction was genuine.
The 200 day EMA remains the line separating a contained correction from a deeper structural change. A decline toward 200 would still occur within a broadly rising trend, but a decisive close below the average would force a reassessment of the entire advance from the spring base. That is why the 200 area belongs in every scenario even though it is currently well below price. It defines the point where the bullish medium term thesis would lose its strongest technical foundation.
⚙️ Momentum Has Stabilized Without Confirming a New Impulse
RSI near 41.8 captures the tension in the chart. The indicator is above oversold territory, but it remains below the neutral 50 line. This tells us that the rebound has relieved immediate pressure without producing broad momentum dominance. A move above 50 would confirm that average gains are beginning to outweigh average losses over the 14 day window. A rejection below 50 would leave the recovery vulnerable to another test of support.
The MACD produces a similar message. The MACD line remains slightly positive, near 0.45, but it is below a signal line near 1.69. The histogram is therefore negative. This is not the configuration of an established downside trend because the indicator remains above zero. It is the configuration of a prior bullish impulse that has slowed. For the recovery to strengthen, the histogram should contract toward zero, the MACD line should turn higher, and price should close through resistance at the same time.
Momentum divergence is not yet decisive. The September price high near 234.75 occurred with a weaker momentum profile than some earlier advances, which warned that the breakout was vulnerable. The subsequent decline validated that warning. The current rebound has not produced a fresh divergence signal because the new swing low near 208 remained well above the summer low around 190. The next useful comparison will come if price revisits 208 while RSI holds above its September low, or if price retests 235 while RSI fails to confirm.
📦 Volume Shows Participation, but the Current Session Is Incomplete
Volume must be interpreted carefully because the September 17 candle is still forming and the series reflects IEX activity rather than consolidated whole market volume. The live session volume in the accepted series was about 1.77 million shares at the analysis cut off, compared with a 20 day average near 3.30 million. It would be incorrect to compare those values as if the session had ended. What matters is whether participation expands into the close and whether a breakout day ultimately finishes above its recent norm.
The late August advance through 228 occurred with a visible expansion in activity, especially on August 27. The following reversal on August 28 also carried heavy participation. That pair of sessions shows that the 228 to 230 area attracted both aggressive buyers and immediate supply. The September high then developed on more ordinary volume before price turned lower. The market has already identified this region as contested. A future move through it should therefore be judged by both closing position and participation.
The decline toward 208 did not resemble uncontrolled capitulation. Volume increased on some down sessions, but the market did not produce the type of extraordinary expansion usually associated with forced liquidation. That helps explain the rebound. Sellers reduced price enough to test medium term support, while buyers still had capacity to defend it. The absence of capitulation is not automatically bullish. It also means that some overhead supply may remain available if price returns to 228.
🧱 The 208 Support Test Was Constructive
The September 14 session is the most important completed candle in the immediate structure. NVIDIA opened near 211.20 dollars, traded as low as 208.94 dollars, and closed near 211 dollars. The candle tested support without closing at the low. The next two completed sessions held above 211 and produced modest progress. The live September 17 session then opened near 218.18 dollars and traded close to 219.87 before settling around 218.9 at the analysis cut off.
This sequence creates a short term base, but not yet a breakout. The market rejected lower prices near 208, rebuilt above 214, and returned to the 20 day EMA. That is the minimum work required for a rebound. The next step is proving that the base can generate a higher high above 220 and then above 228. Without that progression, the recovery may remain only a countertrend move inside the decline from 234.75.
The strength of 208 also comes from its position inside the wider structure. It sits above the 200 day EMA and close to the August 24 low near 207.40. Repeated defense of a similar level suggests that buyers are watching the zone. Repeated tests can also weaken support because each defense consumes demand. If NVIDIA returns to 208 a third time without first establishing a new high, the probability of a breakdown would increase.
🟢 Bullish Scenario: Close Above 228, Then Challenge 235
The bullish scenario begins with a completed daily close above 220. That would confirm that the live rebound is more than an intraday recovery and place price clearly above the 20 day EMA. The stronger confirmation comes above 228. A close through 228, accompanied by expanding participation and RSI moving above 50, would show that buyers have absorbed the supply created by the latest decline.
If 228 becomes support on a retest, the next objective is the 234 to 236 ceiling. This band should not be treated as a routine target. It contains two major highs and represents the upper boundary of the range. A third rejection could reinforce the ceiling. A decisive close above 236 would instead complete a multi month range breakout and restore price discovery. The initial measured expansion could then extend toward 245 and 250, but only after the former ceiling has been tested as support.
The best bullish evidence would be a sequence rather than one large candle. First, price closes above 220. Second, it advances through 228 with broader participation. Third, a pullback holds above one of those levels. Fourth, momentum confirms rather than diverges. That sequence would reduce the risk of chasing a liquidity spike and would provide a clear invalidation point beneath the reclaimed pivot.
🟡 Neutral Scenario: Compression Between 208 and 228
The neutral scenario may be the most realistic near term outcome because the chart contains a rising long term trend and a flat short term range. NVIDIA could continue moving between 208 and 228 while the 20 day EMA flattens and the 50 day EMA rises underneath price. This would allow volatility to compress after the September reversal and give momentum indicators time to reset.
Inside that range, the center near 218 to 220 becomes noisy. Price may cross it repeatedly without producing a durable signal. The better information comes from the edges. A reaction near 208 tests demand. A reaction near 228 tests supply. Traders who treat every movement around 220 as a trend change risk overreacting to normal range behavior.
A neutral range would also fit the wider market environment. NVIDIA is a large component of technology and index exposure, so its chart responds not only to company specific demand but also to interest rates, positioning, and broad risk appetite. The Federal Reserve’s September communication can be reviewed directly in the official statement. Until the market settles its interpretation, compression in a major technology leader would be technically plausible.
🔴 Bearish Scenario: Failure Below 214 Opens 208 and 200
The bearish scenario activates if the rebound fails under 220 and price closes back below the 50 day EMA near 214.83 dollars. That would indicate that the move from 208 did not produce a durable change in control. A close below 214 would expose 208. A decisive break below 208 would remove the immediate higher low and turn attention to the 200 day EMA.
The 200 area is the critical structural test. It combines the moving average with a round number and prior congestion. A temporary move below 200 could still become a bear trap if price reclaims the level quickly. A sustained daily close below it, followed by a failed retest from underneath, would be much more serious. That sequence would place the 190 to 192 summer support region back in play and would flatten the 50 day EMA.
The bearish case becomes more convincing if momentum deteriorates at the same time. RSI falling below 35, MACD moving below zero, and volume expanding on down sessions would confirm that the decline is gaining participation. Without those confirmations, a move toward 200 may remain a test of long term support rather than the beginning of a new bearish trend.
🎯 Educational Trade Frameworks
| Framework | Confirmation | Invalidation | Primary objective |
|---|---|---|---|
| Breakout continuation | Daily close above 228 with improving momentum | Failure back below 220 | 234 to 236, then price discovery |
| Support reaction | Bullish reversal candle between 208 and 214 | Daily close below 208 | 220, then 228 |
| Range rejection | Failed close near 228 with weakening RSI | Daily close above 228 | 220, then 214 |
| Structural breakdown | Close below 200 followed by failed reclaim | Recovery above the 200 day EMA | 190 to 192 support |
A breakout framework should avoid treating an intraday print above 228 as sufficient. The chart has already shown that upper range moves can reverse quickly. Waiting for the daily close sacrifices part of the movement but improves the quality of the signal. A retest offers a second layer of evidence because it reveals whether prior resistance has become demand.
A support reaction framework near 208 or 214 requires visible rejection. The ideal candle would trade below the level during the session, recover, and close in the upper part of its range. Momentum should stabilize rather than accelerate lower. The invalidation must remain clear. If support breaks on a closing basis, the thesis has changed and should not be defended by moving the level.
A bearish range rejection near 228 is different from a structural short thesis below 200. The first is a tactical trade back toward the middle of the range. The second assumes that medium term support has failed. Mixing the two leads to poor risk control. A trader acting on a rejection at 228 should not automatically expect 190. A trader acting on a confirmed break of 200 has much stronger structural evidence.
🌐 NVIDIA Still Carries Broader Market Information
NVIDIA matters beyond its own chart because the company sits at the center of artificial intelligence infrastructure spending and holds a large weight in major United States indices. Its price therefore reflects a combination of company expectations, semiconductor demand, capital expenditure, and broad growth stock positioning. Readers can examine the company’s current disclosures through NVIDIA’s investor filings, while keeping the chart analysis separate from the fundamental thesis.
The market context also matters. The recent Block2Learn analysis of United States import prices and corporate margins explains why inflation and cost pressure can change the valuation environment even when company specific demand remains strong. Technology leaders often react sharply to changes in discount rates because a large share of expected value sits in future earnings. That does not determine NVIDIA’s next candle, but it helps explain why the 228 to 236 range can remain sensitive to macro repricing.
The comparison with Apple’s recent pivot analysis is also useful. Both charts show the importance of distinguishing a long term uptrend from a short term decision zone. A market leader can remain structurally healthy while producing a difficult tactical range. The discipline is the same: define the level, wait for confirmation, and separate a support reaction from a completed breakout.
⚖️ The Block2Learn Base Case
The base case is a continued recovery test between 220 and 228 before NVIDIA chooses a durable direction. The defense of 208, the reclaim of the 50 day EMA, and the position above the 200 day EMA give buyers a modest structural advantage. The RSI below 50, the negative MACD histogram, and the repeated ceiling near 235 prevent a stronger bullish conclusion.
This produces a balanced probability map. The most likely immediate path is not a straight move to a new high or an immediate collapse through 200. It is a contested advance in which 220 must hold and 228 must be absorbed. A rejection below 228 would keep the range intact. A close above 228 would increase the probability of another test of 235. A break below 214 would return control to sellers and place 208 under pressure.
The base case changes only when the chart supplies new evidence. Above 236, range resistance has failed and the trend resumes. Below 200, long term support has failed and the medium term structure deteriorates. Between those boundaries, the market remains in a large consolidation inside a still rising broader trend.
🔭 Final Outlook
NVIDIA has done enough to stabilize, but not enough to declare a new bullish impulse. The rebound from 208 recovered the 50 day EMA and brought price back above the 20 day EMA. Those are constructive developments. The market now has to prove that it can hold the 220 pivot after the current session closes and then confront the much heavier supply near 228.
The strongest bullish signal would be a daily close above 228 followed by a successful retest. That would open another challenge of the 234 to 236 ceiling. The strongest bearish signal would be a failure below 214 followed by a break of 208. That would expose the 200 day EMA and force a broader reassessment of the summer advance.
Until one of those confirmations arrives, NVIDIA should be treated as a strong long term trend trading inside a demanding short term range. The opportunity is real, but so is the supply. The next close matters because it will show whether the rebound has reclaimed structure or only revisited resistance.
To build a repeatable process for reading trend, momentum, confirmation, and invalidation across market regimes, continue through the Block2Learn Learning Path.
This article is provided solely for informational and educational purposes and does not constitute financial or investment advice, a recommendation, or an offer or solicitation to buy or sell any financial instrument or digital asset. See our Financial Disclaimer.
This article was generated with the support of AI and reviewed by the Editorial Team. For more information, see our Terms of Service.


