Ethereum is trying to turn the $2,369 to $2,435 area from a defensive line into a launch point, but the daily structure has not yet earned a clean bullish continuation signal. ETH closed the last completed Binance Spot session at $2,418.26 after defending $2,369.11, and the live candle is pressing back toward $2,450. That recovery matters because price is again testing the 20 day exponential moving average near $2,434.80. It is not enough by itself. The market still sits below the repeated supply zone around $2,530, while the September spike toward $2,666 remains the swing that buyers must eventually reclaim. The tension is therefore precise: price has recovered above the immediate pivot, the medium trend remains constructive, and momentum has reset, yet the next daily close must prove that the bounce can survive contact with overhead supply. Until that happens, Ethereum is holding the pivot rather than breaking the range.
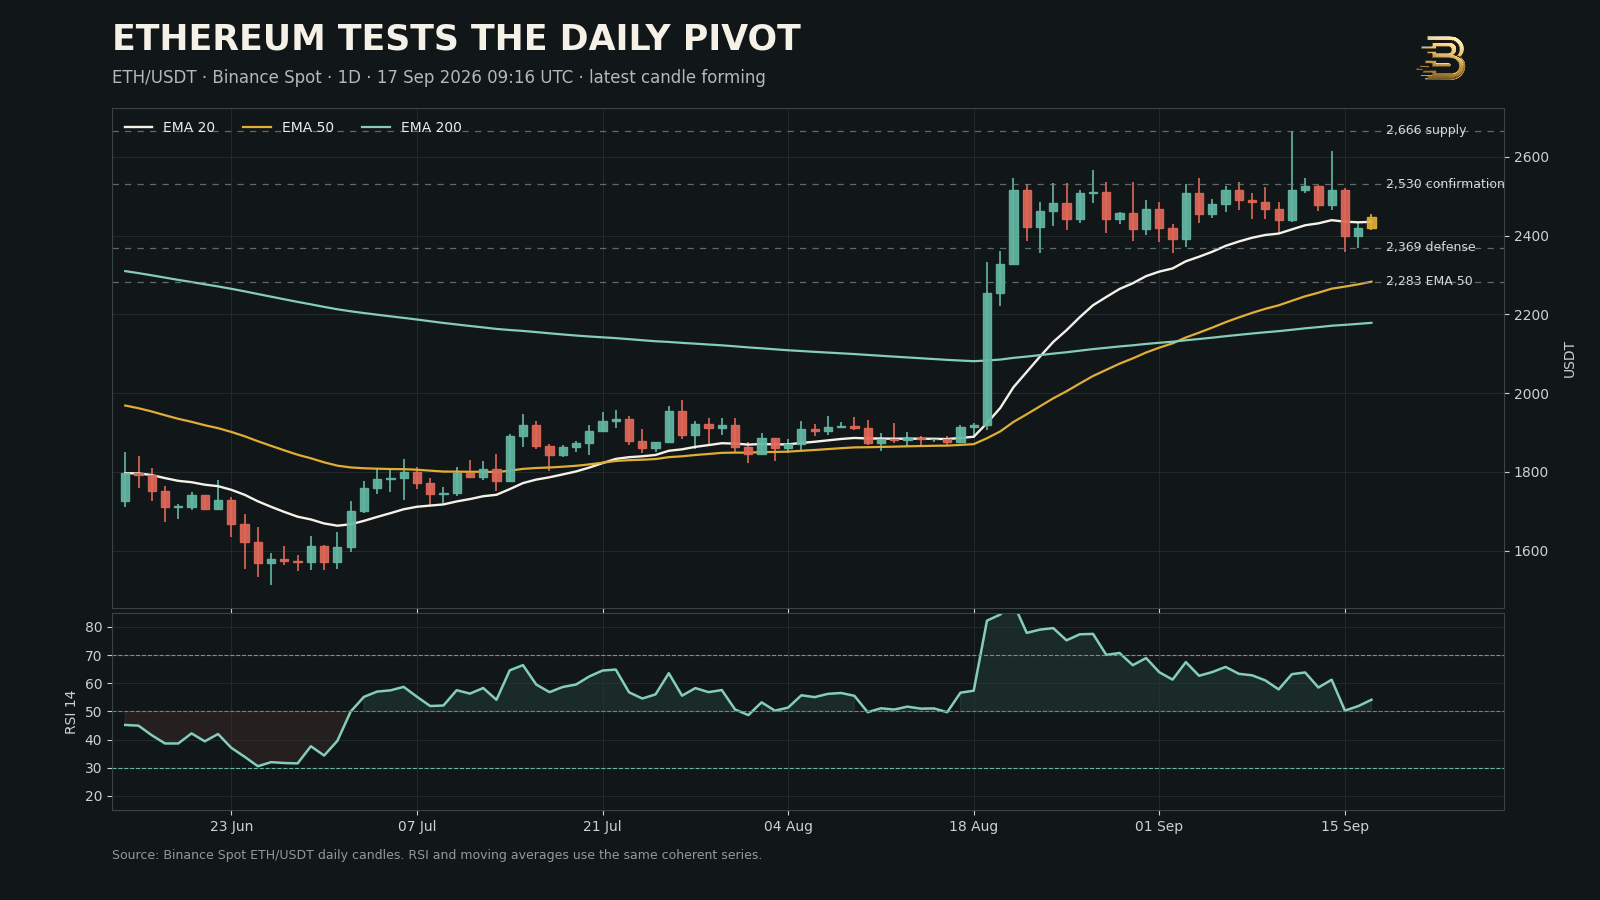
The larger chart still favors buyers because ETH trades above the 50 day exponential moving average near $2,282.78 and the 200 day exponential moving average near $2,178.38. Those rising averages preserve the recovery that began from the summer base, even though the shorter 20 day average has flattened as price moved sideways. RSI near 54.14 adds to the balanced reading. Momentum is no longer overheated, but it has not accelerated into a new impulse. The live candle is also incomplete, so the decisive information will come from where the session closes relative to $2,435 and whether the body can remain above that level. A close above the short average would improve the odds of another test of $2,530. A rejection that returns price below $2,369 would expose $2,283 and convert the current rebound into a failed repair.

🧭 The chart is constructive, but confirmation is still missing
Ethereum’s daily regime changed materially during the August expansion. Price accelerated from the high $1,800 area, cleared the 200 day average, and then established acceptance above the 50 day average. That sequence created a higher value zone rather than a single isolated spike. The market has since spent several weeks rotating between demand near $2,350 and supply between roughly $2,530 and $2,666. This is a broad consolidation after a powerful advance, not a clean trend leg. The distinction matters because continuation traders need a closing breakout, while range traders need evidence that one boundary has failed. In the middle, both sides are vulnerable to false signals.
The last completed candle improved the short term picture by recovering from $2,369.11 and closing at $2,418.26. It did not erase the damage from the September 15 decline, when ETH dropped from the $2,500 region and briefly tested below $2,360. That selloff showed that supply remains active near the upper half of the range. The following recovery shows that buyers are still willing to defend the lower half. Together, the two sessions define compression rather than capitulation. The next useful signal should therefore come from a daily close beyond a boundary, not from an intraday wick inside the existing range.
The most important near term boundary is the cluster formed by the 20 day average near $2,435, the live candle high near $2,454, and recent closes in the $2,460 to $2,490 band. A sustained close above this cluster would place price back into the upper half of the range and make $2,530 the natural test. Failure here would leave the market vulnerable to another sweep of $2,369. This is why the pivot is more important than the current green candle. The reaction around the pivot will reveal whether buyers are building acceptance or merely covering risk after a fast drop.
📐 Key Ethereum levels for the next daily close
| Level | Technical role | What would confirm it |
|---|---|---|
| $2,666 | September swing supply and major breakout barrier | Daily close above the swing followed by a successful retest |
| $2,530 | Immediate confirmation resistance | Daily close with expanding range and firm follow through |
| $2,435 | 20 day average and active pivot | Close above it, then support on a pullback |
| $2,369 | Immediate defense and recent reaction low | Repeated daily closes above the level |
| $2,283 | 50 day trend support | Bullish rejection or fast recovery after a test |
| $2,178 | 200 day regime support | Price holds above it on a closing basis |
The table separates the levels that influence the next session from those that define the broader regime. Traders often compress these horizons and treat every intraday move as a new trend. That approach is especially costly inside a range. A move through $2,435 would improve the immediate setup, but it would not complete the broader breakout. Ethereum would still need to deal with $2,530 and then $2,666. Conversely, a dip below $2,369 would weaken the active bounce, but the medium structure would not turn decisively bearish while price remained above the rising 50 day and 200 day averages. The chart becomes genuinely fragile if sellers force acceptance below $2,283. It becomes structurally damaged if $2,178 fails.
📈 Moving averages show a repaired regime, not a fresh impulse
The order of the daily averages remains favorable. The 20 day average near $2,434.80 is above the 50 day average near $2,282.78, and both stand above the 200 day average near $2,178.38. This alignment says that the August advance was large enough to lift short and medium trend measures above the long trend base. Price also remains above the two slower averages, so the market has not surrendered that recovery. In a healthy continuation, the next step would be for the 20 day average to resume rising while price builds closes above it.
At present, the 20 day average is acting as a decision line because the market has spent too much time around it for the line to remain a simple support signal. A flat short average inside a sideways range reflects balance. It does not predict direction. What matters is whether price can separate from the average and whether the average then begins to slope with that move. A close above $2,435 followed by a hold above $2,400 would restore a more useful bullish relationship. Repeated closes below $2,369 would instead pull the 20 day average lower and increase the probability of contact with the 50 day average.
The distance to the 50 day average deserves attention. At roughly $2,283, it sits about one normal daily range below the $2,369 defense when measured against the 14 day average true range near $94.83. That means a break of $2,369 could reach the medium trend line quickly without requiring an exceptional move. Buyers should not assume that the space between those levels will provide strong support. Sellers should not assume that touching the 50 day average completes a breakdown. The response at $2,283, including the shape of the candle and the following close, would determine whether the medium trend is absorbing supply or beginning to roll over.
⚡ Momentum has reset into a decision zone
RSI near 54.14 is neither stretched nor weak. It reflects a market that has released the excess created by the August surge and now sits close to equilibrium. This is constructive only if price can use the reset to move through resistance. Momentum resets are valuable because they allow a trend to continue without requiring the oscillator to remain overbought. They are not automatic buy signals. If RSI moves through 60 while ETH closes above $2,530, the combination would support a renewed impulse. If RSI slips below 45 while price loses $2,369, the reset would look more like distribution than consolidation.
The oscillator also helps explain why the current bounce should be judged by closing strength. RSI recovered from the neutral line as price defended the lower part of the range, but it has not yet printed a decisive expansion. A live reading can change sharply before the daily candle closes. The better evidence would be a completed close with RSI rising, price above the 20 day average, and the candle body positioned near its high. That combination would show persistent demand. A long upper wick near $2,500 with RSI failing to build would show that supply is still controlling the range ceiling.
Volume provides a similar message. The completed September 16 session traded about 321,896 ETH on Binance Spot, modestly above the recent 20 session average near 283,766 ETH. The defense was therefore supported by meaningful participation, but it did not produce a breakout. A move through $2,530 would be stronger if volume expands beyond the recent average and the close remains firm. A low volume probe above resistance would deserve skepticism. Volume does not need to set a record, but it should confirm that the market is accepting higher prices rather than briefly visiting them.
🟢 Bullish scenario: acceptance above $2,530
The bullish path begins with a completed daily close above $2,435, followed by evidence that the area can act as support. That first step would return ETH to the upper part of its range. The stronger confirmation arrives above $2,530, where several recent advances lost momentum. A close through that level would shift the chart from repair to continuation and place the September high near $2,666 back in focus.
A breakout above $2,530 should be judged by structure, not excitement. The ideal sequence is an expanded daily candle, an RSI move toward or above 60, and a pullback that holds between $2,500 and $2,530. That would show that previous supply has become demand. If the retest succeeds, the market can challenge $2,600 and then $2,666. A close above $2,666 would complete a higher high relative to the September range and open a broader continuation phase. The next targets would then need to be derived from the new structure rather than guessed in advance.
The bullish scenario is invalidated in stages. A rejection from $2,530 that still holds $2,435 keeps the range intact. A rejection that closes below $2,369 damages the immediate setup. A close below $2,283 would challenge the medium trend and force a reassessment of the entire continuation thesis. This staged approach prevents one wick from carrying more meaning than it deserves. It also keeps risk tied to the level that supports the specific trade idea.
🟡 Neutral scenario: rotation between $2,369 and $2,530
The neutral case remains credible because Ethereum has already spent several sessions moving through this band without creating durable acceptance beyond either side. In this scenario, price may recover toward $2,500, fail to close above $2,530, and return toward $2,400. It may also briefly test below $2,369 and recover before the close. These moves would be noisy but consistent with a maturing consolidation above rising medium averages.
For position traders, the neutral regime argues for patience. Entries near the center of the range offer poor distance to both confirmation and invalidation. The more useful opportunities appear near the boundaries, where risk can be defined. A bullish reaction near $2,369 can target the upper range only if the level is defended. A bearish reaction near $2,530 can target the pivot only if supply is visible. Chasing price around $2,440 leaves the trade dependent on a breakout that has not happened.
Consolidation can still be constructive. The monthly change through the last completed candle remains roughly 26 percent, while the weekly change is close to flat. That combination shows a market digesting a strong advance. Time can correct an overextended move even when price does not fall deeply. The neutral case becomes more bullish if lows rise while resistance remains fixed. It becomes more bearish if rallies lose height and repeated tests weaken $2,369.
🔴 Bearish scenario: failure below $2,369
The bearish path begins with a daily close below $2,369 and gains credibility if the market cannot reclaim that level on the next attempt. Such a close would show that the recent defense has failed and would expose the 50 day average near $2,283. Because the 14 day average true range is close to $95, that target is within normal daily movement. Traders should therefore treat a confirmed break as a meaningful change, not as a distant possibility.
The reaction around $2,283 would decide whether the decline is a normal pullback or the start of a deeper repair. A strong lower wick and a close back above $2,320 could preserve the medium uptrend. Continued closes below the 50 day average would shift attention to the 200 day average near $2,178. That level is more important than a simple target because it separates the repaired regime from the old base. Losing it would place the August breakout at risk and could reopen the broad area around $2,000.
The bearish scenario is invalidated if price quickly recovers $2,435 and then closes above $2,530. Short positions initiated on a break of $2,369 should not ignore a fast reclaim. Failed breakdowns can accelerate because sellers become trapped while sidelined buyers reenter. The chart therefore demands closing confirmation on both sides. A wick through support is evidence of volatility. Acceptance below support is evidence of a regime shift.
🎯 Potential long setup
A conservative long setup would wait for a daily close above $2,530 and then look for a retest that holds the $2,500 to $2,530 area. The trade would seek continuation toward $2,600 and $2,666, with invalidation below the reclaimed zone or below the retest low. This approach sacrifices the first part of the move in exchange for evidence that supply has been absorbed.
An aggressive long setup would use a bullish rejection near $2,369, but only if the candle closes back above $2,400 and momentum stabilizes. The initial target would be the 20 day average near $2,435, followed by the upper range near $2,530. Invalidation would sit below the rejection low because the setup depends on that defense. The aggressive version offers better distance to the target but carries greater risk that the range floor is weakening.
Neither setup benefits from entry in the middle without a trigger. The live candle currently sits near the pivot, so the market has not completed either pattern. Waiting for the close is part of the setup, not a missed opportunity. The goal is to trade the reaction that confirms demand, not to predict a candle that remains unfinished.
🧱 Potential short setup
A range short could develop if ETH tests $2,500 to $2,530, prints a clear rejection, and closes back below $2,470. The initial target would be the $2,435 pivot, followed by $2,369 if selling persists. Invalidation would sit above the rejection high or above a confirmed close through $2,530. This setup depends on supply continuing to control the upper boundary.
A breakdown short would require a daily close below $2,369 and a failed attempt to reclaim it. The first objective would be the 50 day average near $2,283. If that line also fails on a closing basis, the 200 day average near $2,178 becomes relevant. Invalidation would follow a recovery above the broken support. The setup should not be initiated solely because price trades below $2,369 during the session. Intraday sweeps have already occurred inside this range, and the close remains the cleaner filter.
Short risk is elevated by the positive order of the medium averages. Selling against an intact rising 50 day and 200 day structure requires faster management than selling a confirmed downtrend. A bearish trade can be correct over one swing while the larger regime remains constructive. The setup therefore needs a specific target and invalidation rather than a broad assumption that Ethereum has entered a lasting decline.
🧠 Block2Learn base case
The base case is a constructive range with a modest bullish bias, not an immediate breakout. Ethereum remains above the 50 day and 200 day averages, the last completed candle defended $2,369 with above average volume, and RSI has reset near the middle of its range. Those facts give buyers a structural advantage. The advantage is limited by repeated supply around $2,530 and by the failure to hold the September push toward $2,666.
The most probable near term path is another test of the $2,500 to $2,530 area, followed by a decision that requires closing confirmation. If price closes through $2,530, the probability shifts toward a run at $2,666. If price rejects and then loses $2,369, the probability shifts toward $2,283. Between those levels, rotation remains more likely than a sustained trend. This base case can change quickly because the current candle is forming near the 20 day average. The close will either strengthen the repair or expose it as a temporary rebound.
This reading also fits the broader rhythm visible across recent crypto coverage. The market is responding to policy and security narratives while price structure remains selective. Our analysis of the latest United States crypto market structure vote explains why regulatory headlines can alter volatility without replacing chart confirmation. Our review of continuous adversarial testing at Coinbase shows how infrastructure risk can influence sentiment even when the technical setup remains governed by support and resistance. Ethereum still has to prove its own breakout through price.
🔍 Confirmation checklist
- Bullish confirmation: daily close above $2,530, RSI moving toward 60, and a successful retest of the breakout zone.
- Major bullish confirmation: daily close above $2,666 followed by continued acceptance.
- Neutral confirmation: continued closes between $2,369 and $2,530 with RSI holding near the middle.
- Bearish confirmation: daily close below $2,369 and a failed reclaim.
- Major bearish confirmation: sustained closes below the 50 day average near $2,283.
The checklist is designed to prevent a common error: treating the first touch as confirmation. Markets often probe a level before choosing direction. The strongest evidence is a completed close, followed by a reaction that shows whether the market accepts the new area. Traders can adjust the trigger to their own horizon, but the logic should remain consistent. A signal is stronger when price, momentum, volume, and the retest point in the same direction.
📚 Learning Path: how to read this setup
Start with market structure before indicators. Identify the August expansion, the September high near $2,666, the lower defense near $2,369, and the current position inside that range. Then use the moving averages to define the broader regime. The 50 day and 200 day lines show that the medium trend remains repaired. The 20 day line shows where the immediate decision is taking place. Finally, use RSI and volume to judge whether a breakout has participation.
This order keeps indicators in context. RSI at 54 does not mean bullish by itself. It matters because price is near a pivot while medium trend support remains below. Volume above its recent average does not guarantee continuation. It matters because buyers defended the range floor with real participation. The complete setup emerges from the relationship among structure, trend, momentum, and confirmation.
Readers who want to compare this pattern with other assets can browse the Block2Learn Chart Analysis archive. The approved examples on Solana resistance and Hyperliquid support illustrate the same principle: levels become meaningful through reaction and confirmation, not through labels alone.
🏁 Final outlook
Ethereum enters the next daily close with a repaired medium trend and an unresolved short term range. The market has defended $2,369, recovered the $2,400 area, and returned to the 20 day average near $2,435. RSI has reset to a balanced 54.14, while price remains above the 50 day and 200 day averages. These conditions support a constructive bias, but they do not confirm a breakout.
The next close should answer the immediate question. Acceptance above $2,435 improves the path toward $2,530. A close above $2,530 confirms that buyers are regaining control and brings $2,666 back into view. Rejection followed by a close below $2,369 invalidates the active repair and exposes $2,283. The base case remains consolidation with a bullish tilt until one boundary gives way.
Ethereum is therefore holding the pivot, not escaping it. The chart rewards discipline at the boundaries and punishes conviction in the middle. Let the close reveal whether momentum has reset for continuation or faded into another rotation.
This article is provided solely for informational and educational purposes and does not constitute financial or investment advice, a recommendation, or an offer or solicitation to buy or sell any financial instrument or digital asset. See our Financial Disclaimer.
This article was generated with the support of AI and reviewed by the Editorial Team. For more information, see our Terms of Service.