


🔍 Key Levels and Current Structure
Solana (SOL) has entered a critical technical zone following a 10% weekly decline, now trading near $177.50 after testing intraday lows of $175.76. The asset has been trapped inside a descending channel since early October, consolidating between major Fibonacci retracements after losing momentum around $230.
The daily chart shows SOL approaching a strong confluence of support:
- 0.236 Fibonacci retracement near $188.45
- 200 EMA at $186.70
- Local demand zone between $173–$180, historically associated with heavy buy-side absorption
Momentum indicators confirm oversold conditions. The Stochastic RSI (26.18 / 36.29) and the RSI (37.40) both suggest short-term exhaustion of selling pressure. Meanwhile, the MACD continues to print red bars, yet the histogram slope is flattening — an early signal that bearish momentum may soon fade.
📊 Key Levels:
🔴 Resistance: $188.45 – $197.90 – $205.54 – $213.19
🟢 Support: $177.00 – $173.16 – $165.00
📈 Moving Averages:
- EMA 9: $195.60
- EMA 26: $207.56
- EMA 50: $208.19
- EMA 200: $186.70
The current candle structure shows a possible double-bottom retest around the $175 area. If this zone holds, it could serve as the base for a short-term relief rally. However, failure to defend this area could open the way toward $165 — the next liquidity pocket visible on the volume profile (VPVR).
🚀 Bullish Scenario
If Solana manages to reclaim the $188–$197 range, the next short-term objective lies around the 0.382 Fibonacci retracement ($197.90), followed by the 0.5 level ($205.54).
A confirmed breakout above the 9-day EMA ($195.60) with increasing volume could trigger a short squeeze and shift sentiment bullish again.
🎯 Long Entry: $188.50–$190.00 range
📍 Stop-loss: $173.00
🎯 Targets: $205.50 → $213.00 → $224.00
📊 Probability: 60% if price closes above 9 EMA with rising volume
A rebound from this zone aligns with the broader weekly support structure, indicating that buyers are defending the lower trendline of the macro channel. The setup suggests potential short-term upside over the next 5–10 trading days as the market resets from oversold levels.
📉 Bearish Scenario
If bulls fail to defend $175–$177, the next significant liquidity cluster lies between $165 and $156. The 0.236 Fibonacci and the 200 EMA are currently providing temporary support, but losing them would invalidate the short-term bullish bias.
🔻 Short Entry: $174.00
📍 Stop-loss: $188.00
🔻 Targets: $165.00 → $156.00 → $140.00
📊 Probability: 55% if RSI breaks below 35 and volume increases on red candles
A breakdown of $173 would mark the first close below the 200 EMA since July, signaling structural weakness that could evolve into a multi-week retracement phase.
📊 Weekly Timeframe – Testing Long-Term Structure

Zooming out to the weekly chart, Solana’s structure remains broadly bullish despite the recent correction. The token has respected a mid-term ascending trendline that began in early 2023, and every pullback to the 50 EMA (176.79) has historically resulted in rebounds.
Currently, the price sits directly at this confluence zone, with the Stochastic RSI (27.73) entering oversold territory. The RSI (47.63) remains neutral but trending lower, indicating that while downside pressure persists, a mid-term bounce remains technically plausible.
The volume profile shows a thick node around $185–$200, meaning heavy accumulation historically occurred in this region. This reinforces the idea that Solana may be forming a base before its next leg higher.
However, the weekly candle close is crucial. A close above $185 would maintain the bullish market structure, while a close below $170 would confirm a breakdown and potentially extend weakness into November.
The MACD on the weekly remains positive but narrowing — suggesting a cooling phase rather than a full reversal.
📈 Monthly Timeframe – Macro Trend Still Intact

The monthly chart presents a broader narrative. Solana’s long-term trend remains structurally bullish, holding above the EMA 12 ($172.73) and the EMA 26 ($150.98). Despite the current retracement, the trendline connecting 2022 and 2024 lows still acts as a macro support axis.
The MACD (21.75 / 0.07) continues to print green, confirming that the long-term bullish momentum is not yet broken. The RSI (54.77) also remains in the mid-range, signaling that the market is undergoing a healthy correction rather than distribution.
If Solana closes October above $180–$185, it would maintain the macro structure intact, validating a potential recovery toward $205–$230 in November or December.
Conversely, a close below $170 would break the EMA confluence and suggest a deeper consolidation phase lasting several months — possibly testing $150–$156 before new buyers return.
📌 Best Strategy: Wait for Confirmation
Given the alignment across all timeframes, the safest approach is to wait for daily confirmation above $188–$190 before re-entering aggressively.
The short-term volatility makes immediate entries risky, but the mid-term setup favors bulls if macro support holds.
🧐 What to Watch in the Coming Days?
📈 A close above $188 on the daily to confirm reversal.
💰 Volume returning above 600K SOL/day as a sign of renewed participation.
🔄 Watch Bitcoin’s correlation — a bounce above $112K could accelerate SOL recovery.
If the daily RSI crosses back above 45 while volume increases, it would likely mark the start of Solana’s next relief phase — potentially targeting $205 within 10–15 days.
In the medium-term (3–5 weeks), if Solana holds above $170–$175, the next macro move could target $230–$250 by late November, aligning with the 0.786 Fibonacci retracement and the upper range of the volume profile.
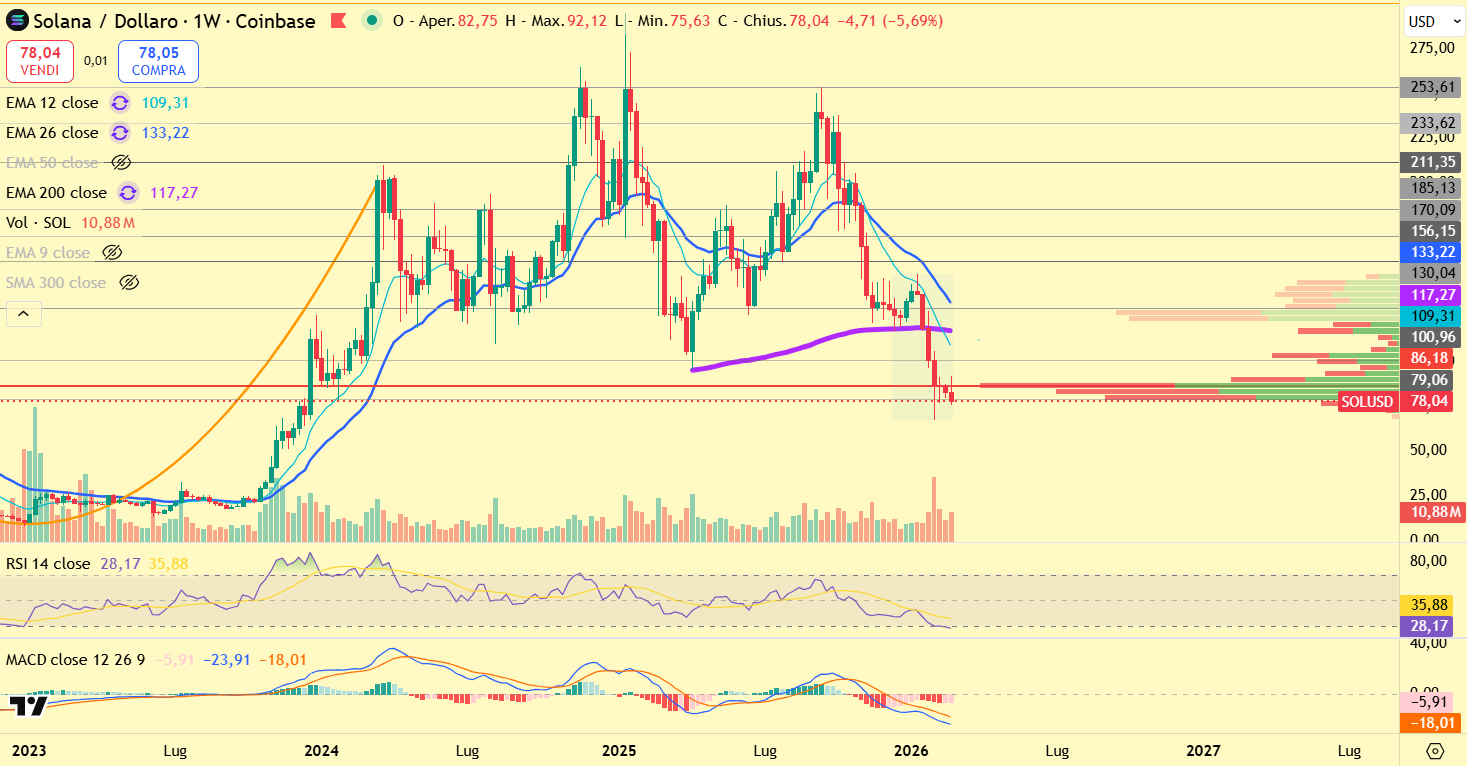
Source of the Chart: TradingView
📜 Disclaimer
This analysis is for informational and educational purposes only and should not be considered financial advice. Trading and investing in cryptocurrencies involve a high level of risk, and past performance is not indicative of future results. Always conduct your own research and consult with a professional financial advisor before making any investment decisions. The information provided here reflects market conditions at the time of writing and may change without notice. Neither the author nor this platform is responsible for any financial losses incurred as a result of trading decisions based on this analysis.