The 4-hour chart of Solana (SOL/USD) reveals a short-term consolidation phase developing around the $200 psychological area, after a strong breakout rally that lifted prices from the mid-$180 zone. The market is currently digesting gains after retesting a cluster of resistance levels near the 200 EMA and the high-volume node around $201–$205. The technical setup remains cautiously bullish, but momentum indicators show that a cooling-off period may precede another leg higher.
🔍 Key Levels and Current Structure
Solana’s latest move from $185 to $204 represents a 10% upward impulse that reclaimed several moving averages, including the 12 EMA, 26 EMA, and 50 EMA. The 4-hour candles show consistent higher lows since October 19, forming a short-term ascending structure that aligns with broader bullish market sentiment. The price is now hovering just below the 200 EMA at $201.5, a critical threshold that defines whether SOL can sustain its mid-term bullish bias.
📊 Key Levels:
- 🔴 Resistance Levels: $201.5 (EMA200), $211.3, $222.0
- 🟢 Support Levels: $198.0, $194.7, $193.3
📈 Moving Averages:
- EMA 9 → $199.28
- EMA 12 → $198.26
- EMA 26 → $195.03
- EMA 50 → $194.69
- EMA 200 → $201.53
The alignment of short-term EMAs (9–26) below the price suggests a short-term bullish bias, though the 200 EMA still acts as a resistance ceiling. The slope of the 50 EMA turning upward confirms a transition phase from bearish compression into neutral-to-bullish territory. If Solana can close multiple 4-hour candles above $201.5, the market could reprice quickly toward $211 and potentially $222, aligning with the upper volume nodes visible on the chart.
📊 Market Liquidity and Volume Profile
The visible range volume profile highlights a heavy cluster of trading activity between $193 and $205, representing the core liquidity zone of the current consolidation range. The price is currently at the upper edge of this range, where buyers face significant sell-side pressure. Above $205, liquidity thins until the next high-volume node at $211.3, which could serve as the next magnet for price action if bulls push through resistance.
Conversely, below $198 the chart shows a thin pocket down to $194.7, meaning a failed breakout attempt could lead to a rapid short-term retracement. The low volume zone between $194–$193 represents the last line of defense for bulls; a clean break below that would expose the $185 region as the next key support.
📈 Technical Indicators Overview
The Stochastic RSI (3, 3, 14, 14) is currently showing a crossover from overbought territory near 85. This suggests that momentum may temporarily slow down as the market digests recent gains. A reset toward the 40–50 zone would provide room for a renewed bullish impulse later in the week.
The RSI (14) stands near 61.47, indicating moderate strength and confirming that the market is not yet overbought. This allows for further upside potential if buying pressure resumes. The RSI has been trending upward since October 20, forming a bullish divergence relative to the price action that reinforces the underlying momentum strength.
The MACD (12, 26, 9) remains positive, with the main line above the signal line at 0.71 vs 2.52, suggesting ongoing bullish bias. However, histogram bars show flattening momentum, a typical sign of short-term consolidation rather than immediate continuation. The MACD’s behavior in the next 12–24 hours will be decisive for confirming whether this pause leads to continuation or reversal.
🚀 Bullish Scenario
For Solana to resume its bullish momentum, the price must secure a 4-hour close above $201.5 (EMA200) and maintain it as support. A successful retest followed by renewed buying could unlock the path toward $211.3—the next resistance level aligned with a major volume node. If that barrier is overcome, momentum traders are likely to target $222.0, which coincides with the late-September swing high and a key psychological zone.
🎯 Long Entry: Above $202.0 after confirmation candle
📍 Stop-loss: Below $197.8
🎯 Targets: $211.3 and $222.0
📊 Probability: 65% if Bitcoin maintains strength above $115K
Additional confirmation could come from a bounce of the RSI above 60 and renewed MACD histogram expansion. Such alignment would indicate the start of a secondary impulse wave within the broader bullish structure that began mid-October.
📉 Bearish Scenario
On the downside, failure to hold above $198 would indicate that bulls are losing momentum at the EMA cluster. A break below this level would expose $194.7 and $193.3, which align with both EMA50 and EMA26—two critical dynamic supports. A daily close below $193 could flip the short-term trend bearish, triggering stop-loss cascades and pushing SOL back toward $185, the origin of the previous breakout.
🔻 Short Entry: Below $197 with confirmation on volume
📍 Stop-loss: Above $202
🎯 Targets: $193 and $185
📊 Probability: 35%, primarily dependent on broader BTC correction
A bearish shift would also likely coincide with a MACD bearish crossover and RSI slipping under 50, both of which would confirm a deeper retracement phase.
📌 Best Strategy: Wait for Confirmation
The optimal approach for traders right now is to remain patient until the $200–$202 zone resolves. This area acts as a short-term equilibrium point where both sides are defending key levels. A confirmed breakout with expanding volume would justify directional exposure, while premature entries risk being caught in sideways chop.
🧐 What to Watch in the Coming Days:
📈 Sustained closes above $201.5 = bullish continuation.
💰 Support tests at $198–$194 = potential accumulation zones.
🔄 Failure to hold $193 = risk of deeper retracement toward $185.
Traders should also monitor Bitcoin’s structure, as BTC strength above $115,000 historically supports altcoin expansions, while retracements tend to cap short-term rallies like Solana’s.
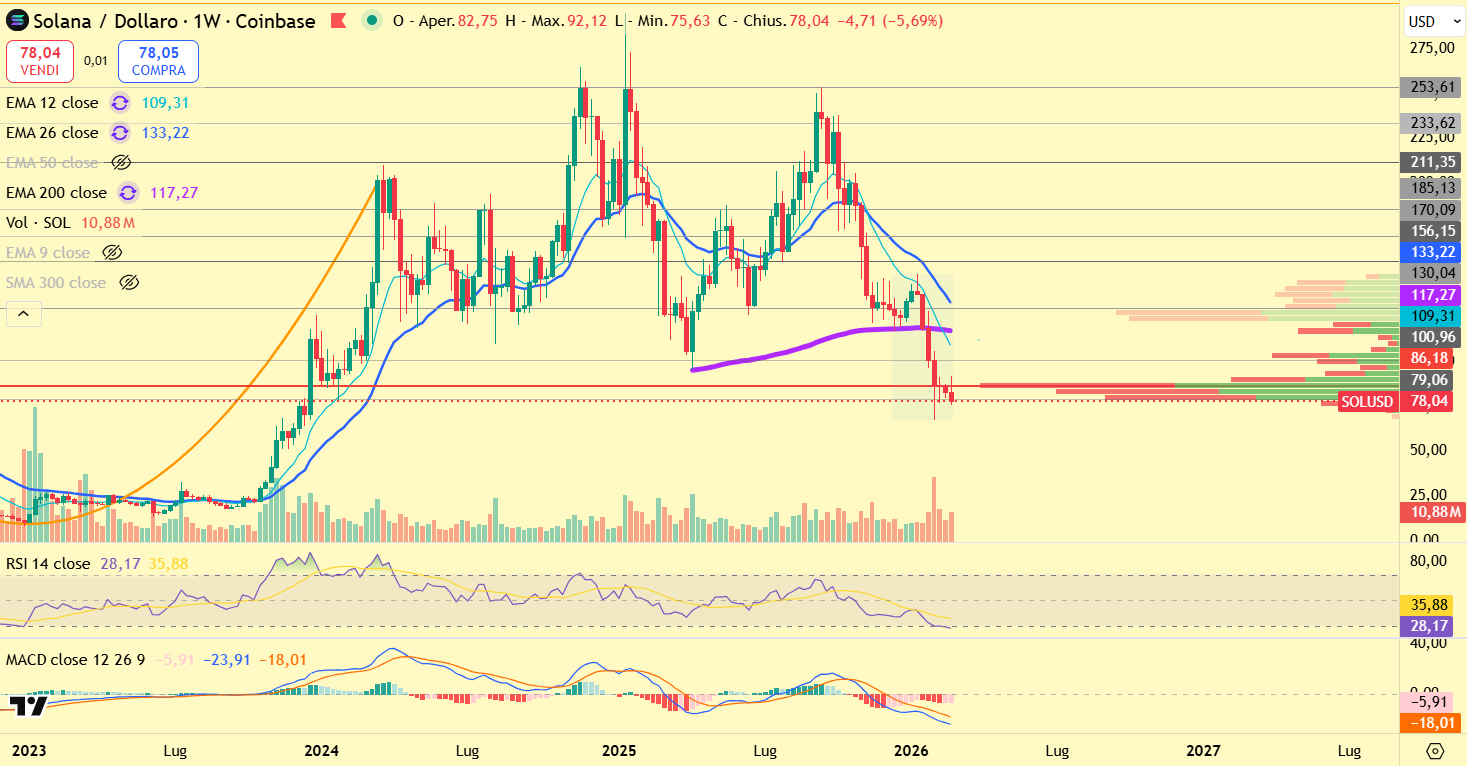
Source of the Chart: TradingView
📜 Disclaimer
This analysis is for informational and educational purposes only and should not be considered financial advice. Trading and investing in cryptocurrencies involve a high level of risk, and past performance is not indicative of future results. Always conduct your own research and consult with a professional financial advisor before making any investment decisions. The information provided here reflects market conditions at the time of writing and may change without notice. Neither the author nor this platform is responsible for any financial losses incurred as a result of trading decisions based on this analysis.