🔍 Key Levels and Current Structure
XRP is currently trading within a critical weekly structure that reflects a broader transition phase after a strong impulsive move earlier in the cycle. On the weekly chart, price action has shifted from expansion to consolidation, with sellers gradually gaining short term control while long term structure remains technically intact.
At the time of analysis, XRP is trading around 2.03 USDT, positioned below the key short and medium term exponential moving averages while still well above the long term EMA 200. This configuration highlights a market that is correcting rather than collapsing, with price compressing inside a descending structure.
The most relevant technical element on the weekly timeframe is the descending trendline connecting the recent lower highs. This trendline has been respected multiple times, confirming a bearish short term bias within a broader bullish macro structure.
Volume has decreased steadily during the pullback, suggesting distribution pressure is controlled and not aggressive. This behavior typically aligns with corrective phases rather than full trend reversals, especially when observed on higher timeframes.
From a market structure perspective, XRP is currently in a weekly pullback within a larger bullish leg that started from the sub 1.00 area. The key question now is whether this pullback evolves into a deeper retracement or resolves with a continuation move.
📊 Key Levels:
🔴 Resistance Levels:
3.01 USDT
2.45 USDT
2.33 USDT
🟢 Support Levels:
2.03 USDT
1.96 USDT
1.36 USDT
The 2.03 to 1.96 zone represents the first major weekly demand cluster. A clean loss of this area would expose price to a deeper move toward the EMA 200 around 1.36, which remains the most critical structural support on the chart.
📈 Moving Averages:
The EMA 12 and EMA 26 are currently above price, acting as dynamic resistance zones around 2.33 and 2.45. The EMA 50 sits near 2.30 and reinforces this resistance cluster, creating a compression zone that price must reclaim to restore bullish momentum.
The EMA 200 remains strongly upward sloping near 1.36, confirming that the long term trend is still bullish despite the ongoing correction. As long as XRP holds above the EMA 200 on a weekly closing basis, the macro structure remains constructive.
📊 Market Liquidity:
Volume profile analysis shows a heavy liquidity concentration between 2.20 and 2.60, indicating that this range acted as a major accumulation and distribution zone in the past. Below current price, liquidity thins out until the 1.80 to 1.60 area, increasing the risk of accelerated moves if weekly support fails.
On the upside, liquidity clusters are stacked above 2.45 and extend toward the 3.00 psychological level. A break and hold above these zones would likely attract strong follow through buying.
🚀 Bullish Scenario
The bullish scenario for XRP requires a structural reclaim of the descending trendline combined with a weekly close above the EMA cluster between 2.30 and 2.45. This would signal that the corrective phase has likely ended and that buyers are regaining control.
In this scenario, price would first need to reclaim the 2.33 level and then hold above 2.45 with expanding weekly volume. A successful breakout would invalidate the current lower high sequence and reopen the path toward higher resistance targets.
🎯 Long Entry:
Confirmed weekly close above 2.45 with trendline break
📍 Stop-loss:
Weekly close below 2.20
🎯 Targets:
First target at 3.01
Second target at 3.50
Extended target toward 4.20 if momentum accelerates
📊 Probability:
Approximately 40 percent under current conditions
This scenario would likely require supportive broader market conditions, particularly strength in Bitcoin and improving risk sentiment across altcoins. Without external confirmation, upside breakouts may struggle to sustain momentum.
📉 Bearish Scenario
The bearish scenario remains active as long as XRP trades below the descending trendline and below the EMA 50. Failure to hold the 2.03 support zone would significantly increase downside risk and confirm further weekly weakness.
A clean weekly close below 1.96 would open the door to a deeper retracement toward the EMA 200, which represents the most important long term support on the chart.
🔻 Short Entry:
Weekly close below 1.96
📍 Stop-loss:
Weekly close back above 2.20
🔻 Targets:
First target at 1.80
Second target at 1.55
Major structural target at 1.36
📊 Probability:
Approximately 60 percent based on current structure and momentum
Momentum indicators support this scenario. The weekly RSI is hovering around 40, showing weakness without being oversold. The MACD histogram remains negative and continues to expand to the downside, confirming bearish momentum on higher timeframes.
📌 Best Strategy: Wait for Confirmation
Given the current structure, the most prudent strategy is patience. XRP is trading in a compression zone where both bullish and bearish outcomes remain valid. Acting prematurely inside this range increases risk without offering favorable risk to reward profiles.
Weekly timeframe traders should wait for a decisive close either above 2.45 or below 1.96 before committing directional exposure. These levels represent structural decision points that will define the next multi week trend.
🧐 What to Watch in the Coming Weeks?
📈 Weekly close relative to the descending trendline
💰 Volume expansion during breakout or breakdown
🔄 Reaction at the EMA 200 if price moves lower
If XRP holds above the EMA 200 and shows bullish divergence on momentum indicators, long term accumulation zones may emerge. Conversely, a failure at that level would shift the macro outlook to neutral or bearish.
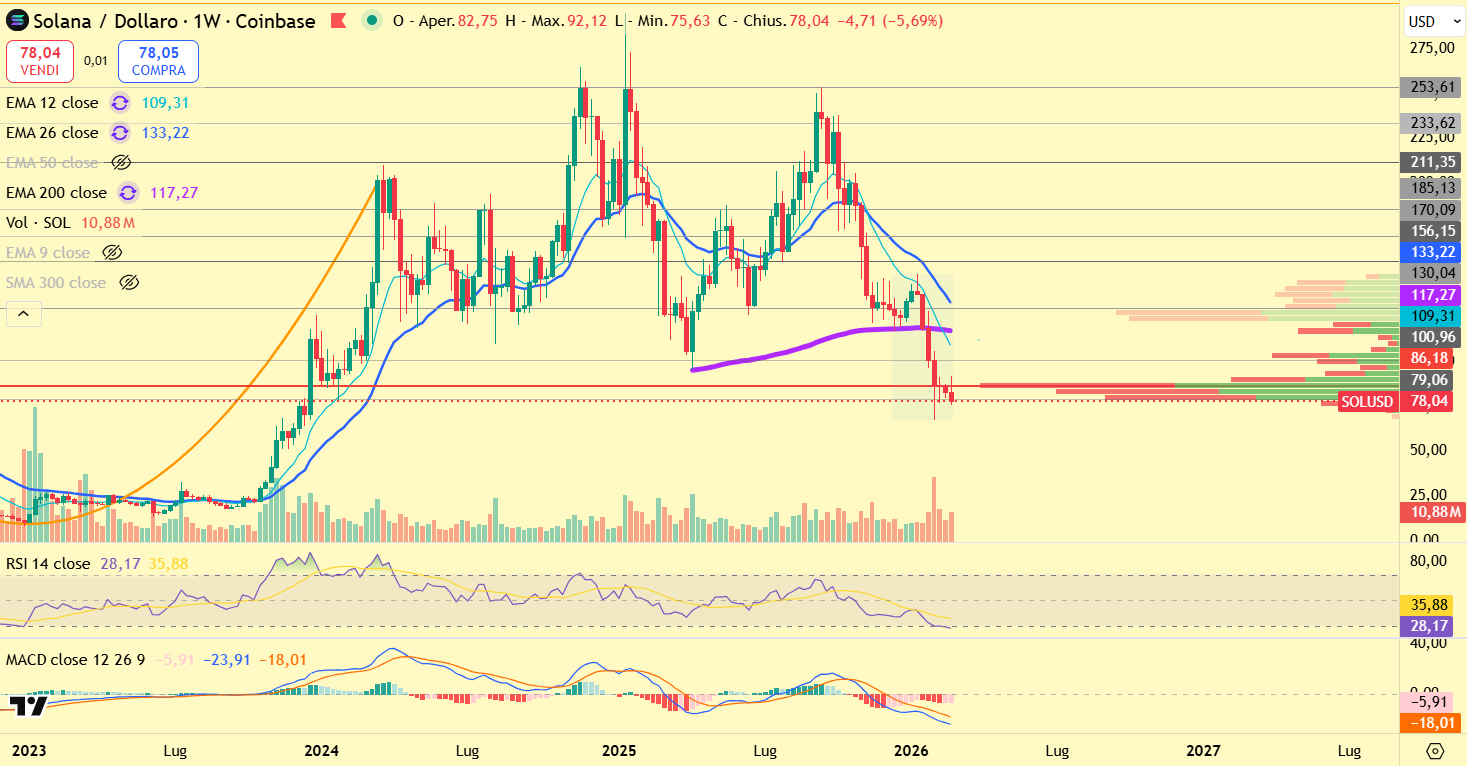
Source of the Chart: TradingView
📜 Disclaimer
This analysis is for informational and educational purposes only and should not be considered financial advice. Trading and investing in cryptocurrencies involve a high level of risk, and past performance is not indicative of future results. Always conduct your own research and consult with a professional financial advisor before making any investment decisions. The information provided here reflects market conditions at the time of writing and may change without notice. Neither the author nor this platform is responsible for any financial losses incurred as a result of trading decisions based on this analysis.