Market Context and Current Structure
Ethereum is currently trading in a technically delicate zone after a prolonged corrective phase that followed the rejection from the upper resistance area. On the daily timeframe, price action shows a clear transition from a bullish expansion phase into a corrective and distributive structure. This shift is not sudden, but rather the result of progressive weakness confirmed by multiple technical signals aligning over time.
The most important element to highlight is the loss of the ascending structure that previously supported higher highs and higher lows. Ethereum failed multiple times to sustain price above the major resistance cluster near the previous distribution highs, creating a series of rejection wicks that ultimately exhausted buying pressure. These rejections marked the start of a broader corrective move, which unfolded in an orderly but persistent manner.
From a structural perspective, Ethereum has now entered a consolidation phase after a sharp downside impulse. The current price action is compressed between declining dynamic resistances and a well defined horizontal support area. This environment suggests that the market is in a decision phase, where the next directional move will likely define the medium term trend.
Key Levels and Current Structure
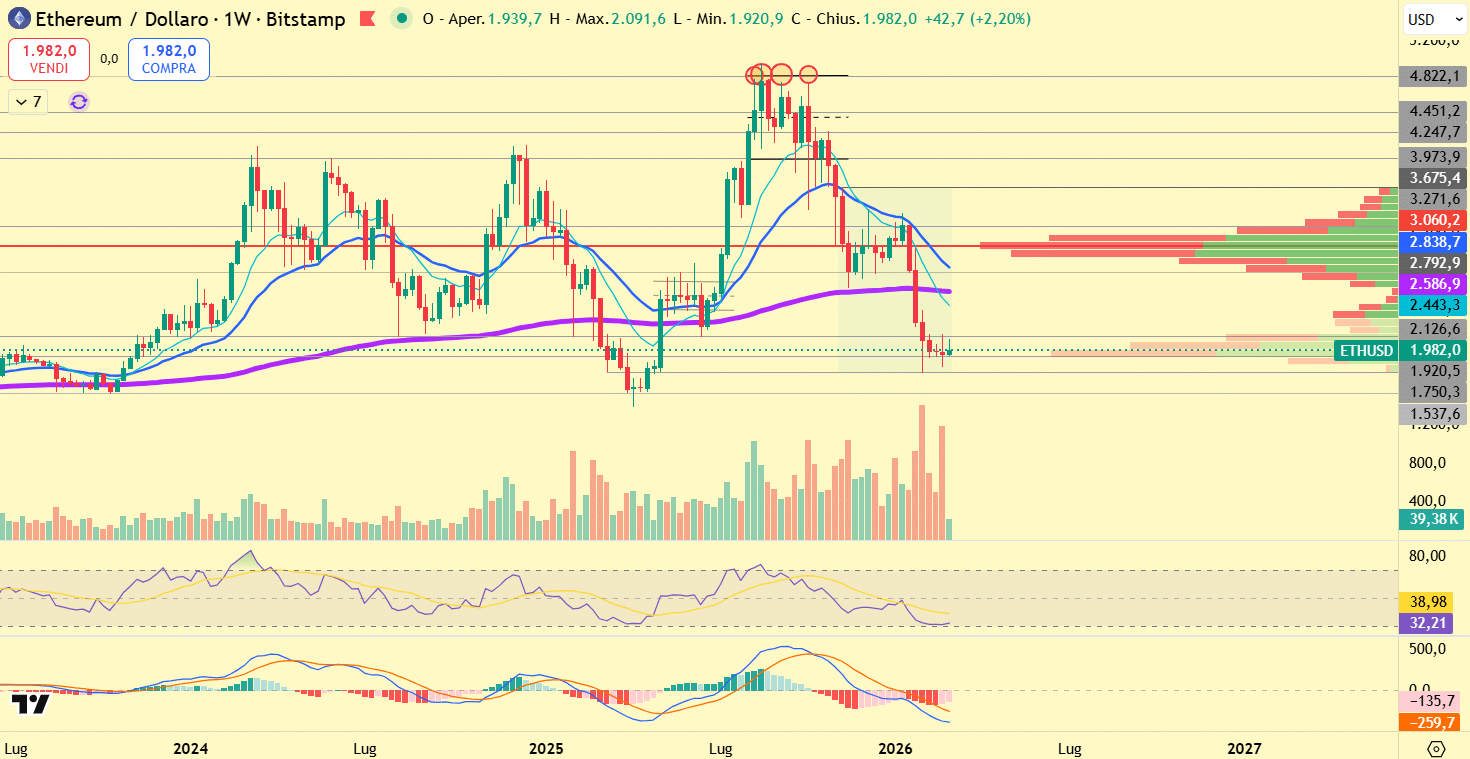
The daily chart highlights several key horizontal levels that are shaping Ethereum’s current market behavior.
📊 Key Levels:
🔴 Resistance Levels:
The first resistance area is located around 2970 to 3000, which aligns with both a former support turned resistance and short term moving averages. This zone has already been tested and rejected, confirming active selling interest.
The second resistance level is positioned near 3180 to 3220, a region with high historical trading activity and visible volume profile concentration.
The major resistance remains in the 3400 to 3500 range, where Ethereum previously formed multiple distribution tops before the corrective breakdown.
🟢 Support Levels:
Immediate support is found around 2950 to 2920, which represents the current price base and a short term equilibrium zone.
Below that, the next critical support lies near 2800, a level that previously acted as a demand zone and could attract buyers again if tested.
A deeper support area exists around 2600 to 2550, which would likely become relevant only in the event of a broader market risk off scenario.
The current structure is best described as a descending consolidation within a broader corrective phase. Price remains capped below declining resistance while struggling to establish higher lows.
Moving Averages and Trend Signals
📈 Moving Averages:
Ethereum is currently trading below its medium and long term moving averages on the daily timeframe. The faster moving averages have crossed below the slower ones, confirming a bearish trend signal that remains valid as long as price stays below these dynamic resistances.
The 50 day moving average is sloping downward and acting as a dynamic resistance, repeatedly rejecting price during minor relief rallies. The 100 day and 200 day moving averages are also flattening and beginning to roll over, indicating that bullish momentum has weakened significantly.
As long as Ethereum remains below these averages, upside moves should be considered corrective rather than trend reversing. A sustained reclaim above the 200 day moving average would be required to structurally invalidate the current bearish bias.
Market Liquidity and Volume Dynamics
📊 Market Liquidity:
Volume analysis shows a clear pattern of distribution followed by declining participation. During the initial breakdown, volume expanded significantly, confirming strong selling pressure and forced position unwinding. However, during the subsequent consolidation, volume has decreased, suggesting a temporary balance between buyers and sellers.
This contraction in volume typically precedes a volatility expansion. The market is effectively coiling, with liquidity building on both sides of the range. A decisive break either above resistance or below support is likely to trigger accelerated movement as resting liquidity is absorbed.
The volume profile visible on the chart highlights a dense node around the current price area, reinforcing the idea that Ethereum is currently trading in a high activity zone where both accumulation and distribution could occur depending on the next catalyst.
Bullish Scenario
🚀 Bullish Scenario:
For a bullish scenario to develop, Ethereum must first defend the current support zone and establish a higher low structure. The most important confirmation would come from a daily close above the 3000 level, followed by acceptance above the descending moving averages.
🎯 Long Entry:
A conservative long setup would only become attractive after a confirmed daily close above 3050, with follow through volume indicating real demand rather than short covering.
📍 Stop loss:
A logical invalidation level for this scenario would be a daily close back below 2920, which would signal that the breakout attempt has failed.
🎯 Targets:
The first upside target would be the 3180 to 3220 resistance zone.
If momentum strengthens, a secondary target could be the 3400 area, where major supply previously entered the market.
📊 Probability:
At this stage, the bullish scenario carries a moderate probability and depends heavily on broader market sentiment and Bitcoin stability. Without a clear reclaim of key moving averages, upside moves remain vulnerable to rejection.
Bearish Scenario
📉 Bearish Scenario:
The bearish scenario remains technically dominant unless proven otherwise. Failure to hold the current support zone would expose Ethereum to another downside impulse within the existing corrective trend.
🔻 Short Entry:
A breakdown below 2920 with a strong daily close would present a bearish continuation signal. Aggressive traders may also consider rejection plays near the 3000 resistance area if price fails to reclaim it convincingly.
📍 Stop loss:
For short positions, invalidation would occur on a sustained daily close above 3050 to 3080, indicating a structural shift.
🔻 Targets:
The first downside target would be the 2800 support zone.
If selling pressure accelerates, a move toward 2600 to 2550 cannot be excluded, especially in a broader market drawdown scenario.
📊 Probability:
Given the current trend structure and moving average alignment, the bearish continuation scenario still carries a higher probability in the short to medium term.
Best Strategy: Wait for Confirmation
📌 Best Strategy: Wait for Confirmation
In the current market environment, patience is the most effective strategy. Ethereum is trading in a compressed range where premature positioning carries elevated risk. Traders should prioritize confirmation over anticipation, allowing the market to reveal its intent through decisive price action.
🧐 What to Watch in the Coming Days?
📈 Whether Ethereum can reclaim and hold above the 3000 level with volume
💰 Changes in volume behavior during range break attempts
🔄 Reaction at the 2800 support if downside pressure resumes
The next major move will likely define Ethereum’s trajectory for the coming weeks, making this consolidation phase a critical inflection point rather than a period to force trades.
Source of the Chart: TradingView
📜 Disclaimer
This analysis is for informational and educational purposes only and should not be considered financial advice. Trading and investing in cryptocurrencies involve a high level of risk, and past performance is not indicative of future results. Always conduct your own research and consult with a professional financial advisor before making any investment decisions. The information provided here reflects market conditions at the time of writing and may change without notice. Neither the author nor this platform is responsible for any financial losses incurred as a result of trading decisions based on this analysis.


 .90 Support Zone" data-lazy-src="https://block2learn.com/wp-content/uploads/2026/03/img_0562.jpg"/>