Solana is currently trading at a technically sensitive area where short term recovery attempts are colliding with higher timeframe structural resistance. After a prolonged corrective phase, price action is showing early signs of stabilization, but confirmation is still required before any sustained directional move can be assumed. This analysis focuses on market structure, key levels, momentum indicators, liquidity dynamics, and scenario based outcomes, following a disciplined and process driven approach.
At the time of analysis, Solana is trading around 135 USD on the daily timeframe. The broader context remains corrective when viewed from higher timeframes, but short term momentum has improved compared to the December lows. This places Solana in a transitional phase rather than a confirmed trend.
🔍 Key Levels and Current Structure
From a structural perspective, Solana experienced a clear distribution phase after failing to sustain acceptance above the 160 to 170 USD area. That rejection initiated a sequence of lower highs and lower lows, defining a bearish market structure on the daily timeframe.
However, the most recent price action shows a deviation from that structure. The formation of a higher low around the 125 USD area, followed by a recovery above short term moving averages, suggests that downside momentum is weakening.
At the same time, price is now approaching a dense zone of technical confluence where previous support has turned into resistance.
📊 Key Levels
🔴 Resistance Levels:
136.50 USD
145.00 USD
160.00 USD
🟢 Support Levels:
133.00 USD
130.00 USD
125.00 USD
The 136 to 138 USD region is particularly important. It aligns with the EMA 50 on the daily chart and coincides with visible volume profile resistance. Rejection from this zone would reinforce the idea that the current move is a corrective bounce within a broader bearish structure.
A daily close above 145 USD would be the first meaningful signal that Solana is attempting to rebuild a higher timeframe bullish structure.
📈 Moving Averages
Solana is currently trading above the EMA 9, EMA 12, and EMA 26, which confirms short term momentum strength. However, the EMA 50 is still acting as dynamic resistance, and the EMA 200 remains far above price near the 160 USD region.
This configuration reflects a market in recovery mode rather than trend continuation.
📈 Moving Averages Analysis
The EMA 9 and EMA 12 crossing above the EMA 26 indicates short term bullish momentum.
The EMA 50 at approximately 136 USD represents the first major dynamic resistance.
The EMA 200 at approximately 162 USD defines the macro trend boundary.
As long as price remains below the EMA 200, Solana should be considered in a broader corrective phase. Sustainable bull trends historically require acceptance above this level with expanding volume.
📊 Market Liquidity and Volume Dynamics
Volume behavior provides critical insight into the quality of the recent move. The recovery from the 125 USD area occurred with moderate but improving volume, suggesting short covering and selective accumulation rather than aggressive new demand.
The volume profile visible on the chart shows a high liquidity node between 130 and 135 USD. This area is acting as a short term equilibrium zone. Acceptance above it would favor continuation toward higher resistance, while failure would increase the probability of range continuation or rejection.
Liquidity above current price is concentrated between 145 and 150 USD. This zone represents a logical upside magnet if momentum accelerates. On the downside, liquidity remains relatively thin below 130 USD until the 125 USD support, increasing the risk of fast downside moves if that level fails.
📉 Momentum Indicators
Momentum indicators are aligned with a short term bullish bias but are approaching levels where continuation becomes conditional.
The RSI 14 is currently near 57, which indicates neutral to mildly bullish momentum. This suggests there is still room for upside before overbought conditions are reached.
The Stochastic RSI is already in overbought territory above 90. This does not automatically imply reversal, but it does warn that momentum may slow or consolidate before further upside.
The MACD histogram has turned positive, and the signal lines are converging upward. This supports the idea that bearish momentum has been neutralized, but the distance between the lines remains limited, indicating that trend strength is still developing.
🚀 Bullish Scenario
For the bullish scenario to unfold, Solana must demonstrate acceptance above the 136 to 138 USD resistance zone on a daily closing basis.
This would confirm that buyers are willing to absorb supply at the EMA 50 and convert former resistance into support.
🎯 Long Entry:
Acceptance above 138 USD on a daily close with stable volume
📍 Stop loss:
Below 130 USD which would invalidate the higher low structure
🎯 Targets:
145 USD as the first objective
160 USD as the major structural resistance and EMA 200 test
📊 Probability:
40 percent
This scenario requires follow through volume and stable broader market conditions. Without volume expansion, upside attempts are likely to stall into resistance.
📉 Bearish Scenario
The bearish scenario becomes dominant if Solana fails to hold above the 133 to 130 USD support zone.
A rejection from the EMA 50 followed by a daily close below 130 USD would signal that the recent move was a corrective bounce rather than the start of a trend reversal.
🔻 Short Entry:
Rejection from the 136 USD area followed by loss of 130 USD
📍 Stop loss:
Above 140 USD
🔻 Targets:
125 USD as first support
Below 125 USD opens downside toward the 115 to 110 USD region
📊 Probability:
60 percent
Given the higher timeframe structure, the bearish scenario currently carries a slightly higher probability unless key resistance is reclaimed.
📌 Best Strategy: Wait for Confirmation
The most prudent approach at this stage is patience. Solana is at a decision point where both continuation and rejection are plausible.
Aggressive positioning inside this range exposes traders to whipsaw risk. The market is offering information, not confirmation.
🧐 What to Watch in the Coming Days?
📈 Daily closes relative to 136 and 138 USD
💰 Volume expansion during attempts to break resistance
🔄 Reaction at the 130 USD support if price retraces
A clean break and hold above resistance would shift the bias toward trend rebuilding. Failure would confirm continuation of the broader corrective phase.
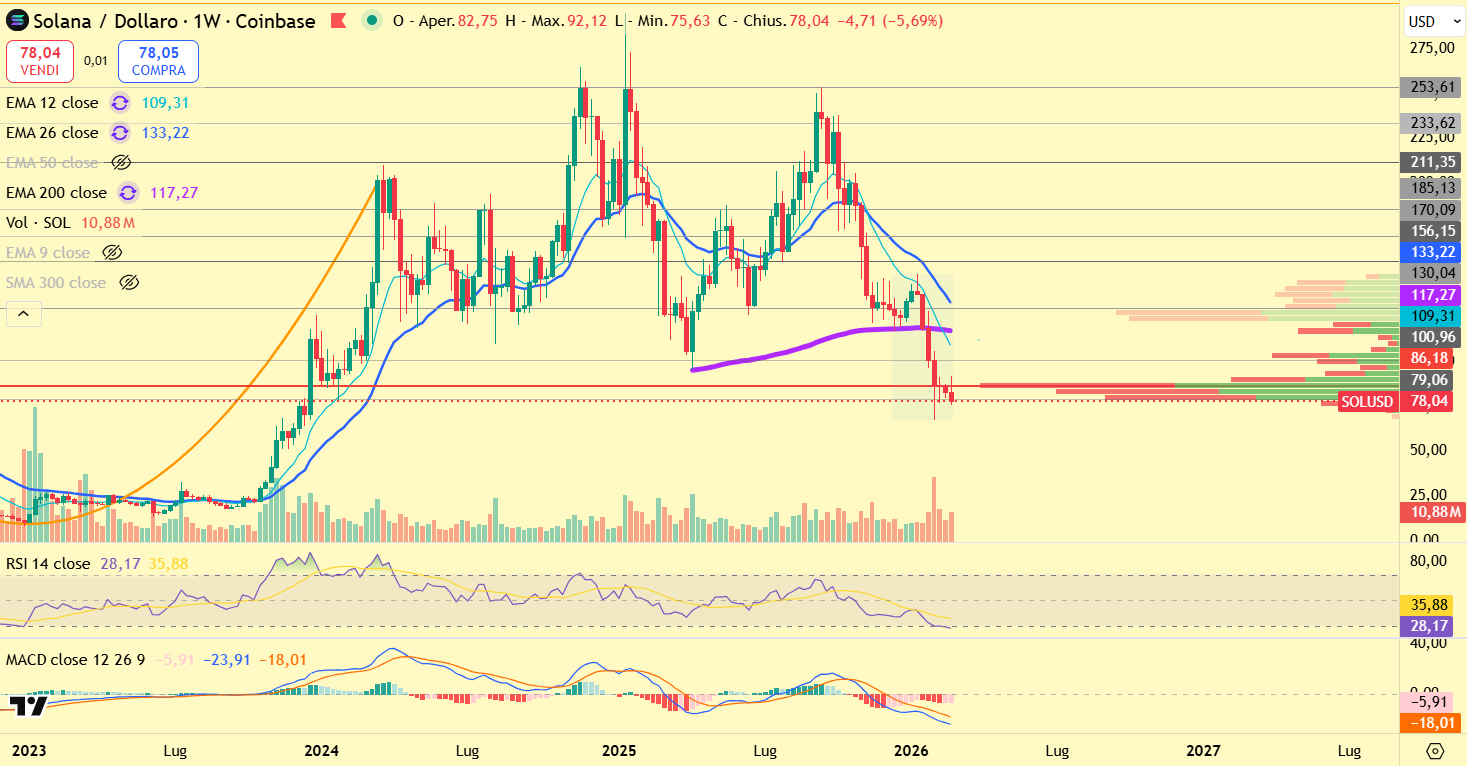
Source of the Chart: TradingView
📜 Disclaimer
This analysis is for informational and educational purposes only and should not be considered financial advice. Trading and investing in cryptocurrencies involve a high level of risk, and past performance is not indicative of future results. Always conduct your own research and consult with a professional financial advisor before making any investment decisions. The information provided here reflects market conditions at the time of writing and may change without notice. Neither the author nor this platform is responsible for any financial losses incurred as a result of trading decisions based on this analysis.