January 2026 may be remembered as a quiet turning point for crypto markets. While price action across major assets remained weak and sentiment stayed defensive, a deeper layer of the market was sending a very different message. Stablecoin liquidity reached unprecedented levels, touching an estimated ten trillion dollars in transaction volume in a single month. This was not a speculative spike driven by leverage or retail frenzy. It was structural, persistent, and largely disconnected from short term price performance.
The stablecoin liquidity signal emerging from January forces investors to rethink how capital moves in crypto during risk off environments. Instead of exiting the system, liquidity remained on chain. Instead of collapsing, transactional activity accelerated. The implication is simple but powerful. Crypto may not be overvalued. It may be mispriced relative to the level of capital already embedded in its infrastructure.
This article explores what the stablecoin liquidity signal really represents, why January’s data matters far beyond price charts, and how this shift could shape the next market repricing phase.
Understanding the stablecoin liquidity signal
Stablecoins are often misunderstood as passive parking assets. In reality, they are the primary transmission mechanism for liquidity across decentralized markets. Every rotation into decentralized finance, real world asset protocols, derivatives platforms, and layer one ecosystems begins with stablecoin movement.
The stablecoin liquidity signal refers to the volume, velocity, and destination of stablecoin flows rather than their market capitalization alone. High issuance without usage can reflect fear. High transactional volume combined with sector rotation reflects preparation.
In January, stablecoin volume surged to record levels even as Bitcoin posted one of its weakest monthly performances since 2022. According to data from Artemis Terminal https://app.artemis.xyz, stablecoin transaction volume approached ten trillion dollars, representing nearly one third of the entire volume recorded in the previous year.
This divergence between price and liquidity is rare. It suggests that capital was not leaving crypto. It was repositioning within it.
Liquidity did not hide, it redeployed
One of the most important aspects of the January stablecoin liquidity signal is where capital flowed. While risk assets declined, stablecoins were not simply sitting idle in wallets. They were actively deployed into productive on chain sectors.
Real world asset protocols were a primary beneficiary. Tokenized treasuries, on chain credit, and yield bearing instruments absorbed a significant share of inflows. Data from RWAxyz https://app.rwa.xyz shows that total real world asset value locked reached a new all time high above twenty four billion dollars during the month.
This matters because real world assets are not speculative placeholders. They represent long duration capital commitments that require confidence in settlement, compliance, and infrastructure stability. Capital does not move into these sectors unless it expects continuity.
The stablecoin liquidity signal here is clear. Investors were not abandoning crypto during volatility. They were repositioning into lower volatility, yield oriented, infrastructure based use cases.
USDC, network demand, and Solana’s role
Another key dimension of the January data was the distribution of stablecoin issuance across networks. USDC issuance increased significantly on Solana, reinforcing the idea that stablecoin growth is now closely tied to network utility rather than speculation.
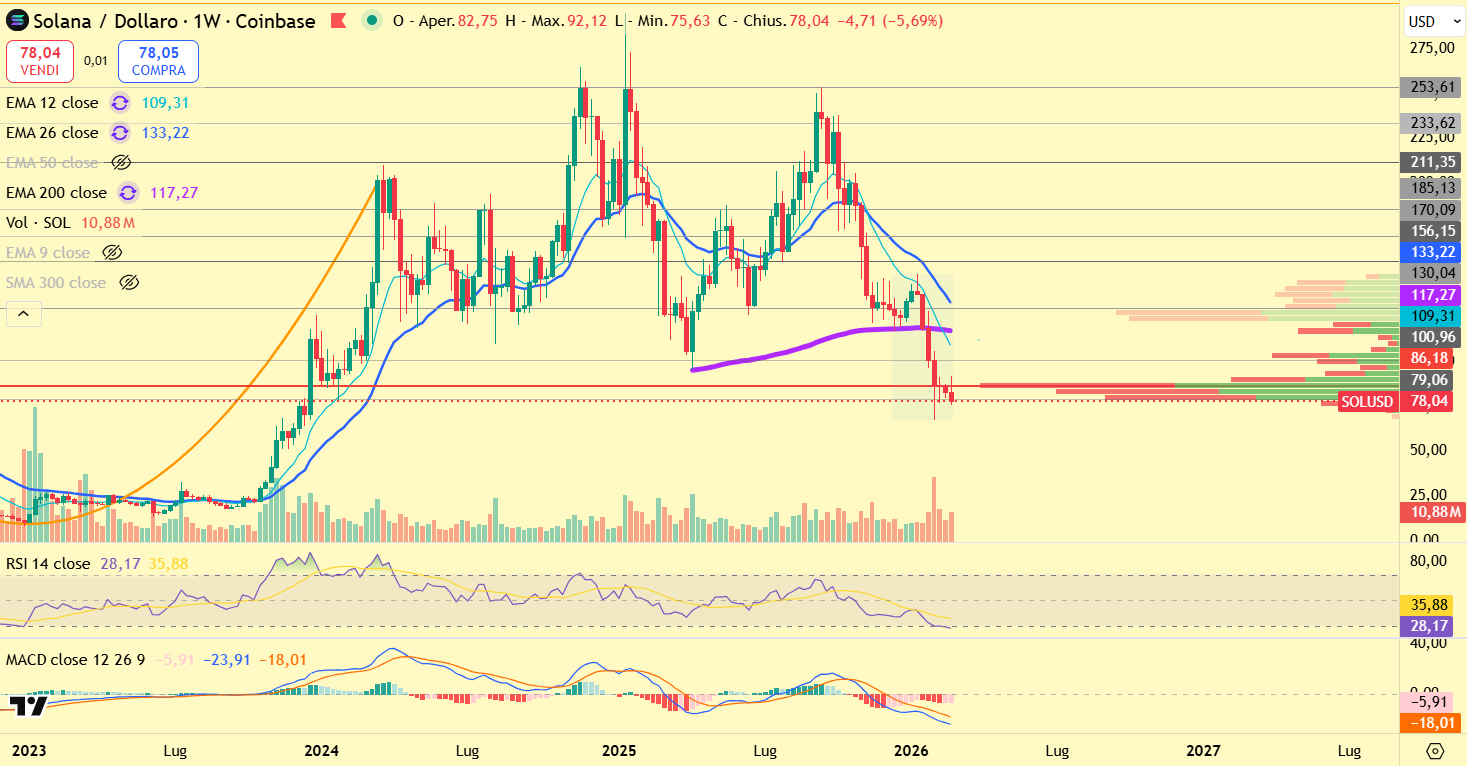
Solana processed close to five hundred billion dollars in transaction volume during the month, ranking among the highest across all chains despite its native asset declining in price. This contradiction highlights a crucial insight. Network usage can grow even when token price lags.
From a market structure perspective, this creates a disconnect between perceived value and actual utility. When stablecoin liquidity continues to flow through a network, it increases structural demand for blockspace, settlement reliability, and application throughput.
For long term investors, this is a classic undervaluation setup. Price reflects sentiment. Liquidity reflects preparation.
More on Solana market structure dynamics can be found on Block2Learn https://block2learn.com/category/solana
Stablecoins as forward indicators, not defensive tools
Historically, large stablecoin inflows were often interpreted as fear driven behavior. Investors sold volatile assets and waited on the sidelines. That framework no longer fully applies.
In modern crypto markets, stablecoins are working capital. They are used to enter protocols, provide liquidity, settle trades, fund startups, and bridge between ecosystems.
A telling example came in January when Y Combinator confirmed that startups could accept funding directly in stablecoins. This decision reflects institutional acceptance of stablecoins as a legitimate financial rail rather than a temporary hedge.
When venture capital, real world asset platforms, and decentralized applications all rely on stablecoins simultaneously, high stablecoin volume becomes a sign of system activity, not system stress.
The stablecoin liquidity signal therefore functions more like a macro indicator. It shows where capital is positioning ahead of repricing events.
Why price weakness does not invalidate the signal
Skeptics may argue that falling prices contradict bullish interpretations. However, markets rarely reprice while capital is still positioning. Repricing occurs after liquidity has already entered the system and risk appetite flips.
During January, Bitcoin declined, large cap altcoins underperformed, and volatility compressed. At the same time, stablecoin flows expanded. This combination historically precedes inflection points rather than breakdowns.
Liquidity tends to lead price, not follow it. This dynamic is well documented across traditional markets and increasingly visible in crypto.
From a valuation standpoint, when transactional volume and capital commitment rise while prices stagnate, it creates asymmetry. Upside potential increases because downside risk is already absorbed by defensive positioning.
Stablecoin dominance and market undervaluation
Another overlooked factor is the relationship between stablecoin dominance and total crypto market capitalization. As stablecoin share of total market value rises, it increases dry powder availability.
In January, stablecoin dominance expanded even as total market capitalization contracted. This suggests that capital is not exiting the asset class. It is waiting.
Historically, periods of elevated stablecoin dominance have preceded aggressive expansion phases once confidence returns. This pattern was visible in 2020, 2023, and now again in early 2026.
On chain liquidity acts as compressed energy. When released, it moves fast.
Implications for investors and builders
For investors, the stablecoin liquidity signal changes how risk should be assessed. Instead of focusing solely on price action, attention should shift to flow data, sector rotation, and capital commitment duration.
For builders, it confirms that infrastructure investment remains attractive. Applications that capture stablecoin velocity, settlement efficiency, and yield generation are likely to benefit disproportionately once markets turn risk on.
Block2Learn continues to track these dynamics across macro, on chain, and market structure layers. More research on liquidity flows and market trends is available here https://block2learn.com/category/market-trends
What to watch next
Several indicators will determine whether the January signal evolves into a full repricing phase.
Sustained stablecoin issuance without contraction
Continued growth in real world asset value locked
Network transaction volume holding up despite price volatility
A shift in derivatives positioning from defensive to neutral
If these conditions persist, the market will likely reprice not because of narrative shifts, but because liquidity already positioned demands expression.
Closing perspective
January’s ten trillion dollar stablecoin volume was not noise. It was structure forming beneath the surface. While prices reflected caution, liquidity reflected confidence in the system’s durability.
The stablecoin liquidity signal suggests crypto is not waiting for new capital to enter. It is waiting for sentiment to catch up with capital that is already here.
Markets rarely offer such a clean divergence between fear and preparation. When they do, it usually pays to listen to liquidity rather than headlines.