

🔍 Key Levels and Current Structure
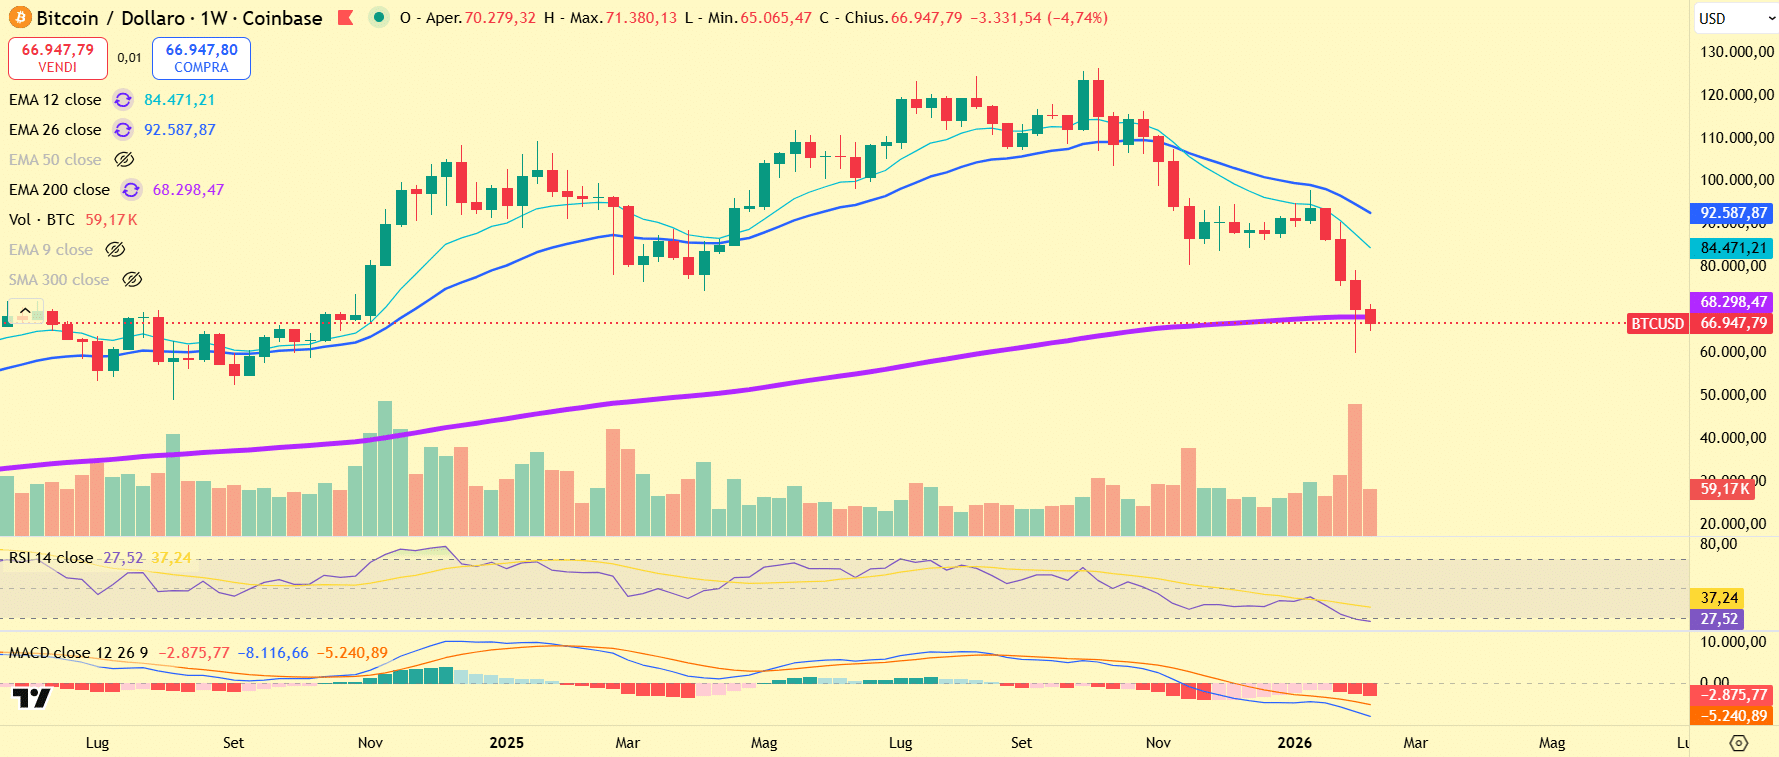
Bitcoin is currently trading in a critical weekly transition phase after a prolonged distribution structure that started near the cycle highs. The weekly chart shows a clear shift from trend continuation to trend degradation, with price now interacting with long term moving averages that historically define bull versus bear regimes.
From a structural perspective, Bitcoin has lost the weekly EMA 12 and EMA 26, both of which had previously acted as dynamic support throughout the bullish expansion. The failure to reclaim these levels on weekly closes has shifted market control from trend buyers to defensive sellers.
At the moment, price is compressing around the weekly EMA 200, which sits near the 68,000 area. This level is structurally important not only because of its long term nature, but also because it represents the average cost basis of longer term participants who entered during the prior accumulation phase.
The broader structure now resembles a topping distribution followed by a descending channel. Higher highs are no longer being sustained, weekly closes are progressively lower, and volatility expansion to the downside has increased. This combination confirms that Bitcoin is no longer in a momentum driven bull phase, but in a corrective to bearish regime where liquidity preservation becomes dominant.
📊 Key Levels:
🔴 Resistance Levels:
92,500
84,500
78,500
🟢 Support Levels:
68,000
62,000
55,000
The resistance band between 84,000 and 92,500 corresponds to the lost weekly EMA cluster and prior distribution highs. Any recovery into this zone without strong volume expansion would likely be corrective rather than trend reversing.
On the downside, the 68,000 level is the immediate structural pivot. A sustained weekly close below this area would open the path toward deeper liquidity pockets at 62,000 and potentially 55,000, which aligns with historical realized price support zones.
📈 Moving Averages:
The EMA structure is now clearly bearish. The EMA 12 has crossed below the EMA 26, and both are sloping downward. This crossover on the weekly timeframe historically signals medium term trend exhaustion rather than short term noise.
The EMA 200 is flat to slightly rising, indicating that long term trend damage is not yet complete, but it is under direct pressure. In prior cycles, once Bitcoin decisively lost the weekly EMA 200, price tended to accelerate lower before finding a durable bottom.
📊 Market Liquidity:
Volume behavior confirms the structural shift. Distribution volume was elevated near the highs, followed by declining participation during consolidation attempts. The most recent weekly candles show renewed volume expansion on down moves, a classic sign of supply dominance.
This suggests that liquidity is no longer passively supporting price, but actively exiting on relief rallies.
🚀 Bullish Scenario
The bullish scenario at this stage is conditional and requires confirmation rather than anticipation.
For Bitcoin to regain a constructive weekly outlook, price must first defend the EMA 200 and hold above 68,000 on a closing basis. From there, a recovery toward the EMA 26 would need to occur with improving volume and tighter weekly ranges.
A bullish resolution would require a reclaim of the 78,500 to 84,500 zone, followed by a weekly close above the EMA cluster. Without that, any upside move remains corrective within a broader bearish structure.
🎯 Long Entry:
Confirmed weekly close above 78,500 with volume expansion
📍 Stop loss:
Weekly close below 68,000
🎯 Targets:
84,500
92,500
📊 Probability:
30 percent
This scenario depends heavily on external liquidity improvement and a clear shift in risk appetite. At present, conditions do not yet support this outcome, but it remains structurally possible if macro conditions ease and sellers fail to press below long term support.
📉 Bearish Scenario
The bearish scenario is currently the dominant path based on structure, momentum, and volume.
A clean weekly close below the EMA 200 would mark a decisive regime shift. Historically, such breakdowns tend to trigger accelerated downside as systematic participants reduce exposure and long term holders are tested.
In this scenario, the first objective lies near 62,000, which represents a prior high volume node and psychological support. Failure to hold that level would expose the 55,000 zone, which aligns with realized price metrics and prior cycle consolidation.
🔻 Short Entry:
Weekly close below 68,000
📍 Stop loss:
Weekly close back above 72,500
🔻 Targets:
62,000
55,000
📊 Probability:
70 percent
This scenario aligns with current momentum indicators. The RSI on the weekly timeframe is trending downward and has not yet reached historical oversold levels, suggesting room for further downside before exhaustion. The MACD remains deeply negative, with widening separation between signal and histogram, confirming trend continuation rather than bottoming behavior.
📌 Best Strategy: Wait for Confirmation
At this stage, the highest risk strategy is prediction. The safest approach is confirmation based execution.
Bitcoin is sitting at a structural inflection point where long term participants are being tested, but no clear reversal signal has yet emerged. Weekly timeframes demand patience. Premature positioning against trend direction historically results in drawdowns rather than optimal entries.
From a professional trading desk perspective, the correct approach is to let the weekly structure resolve. Either Bitcoin reclaims lost moving averages and confirms strength, or it breaks the EMA 200 and confirms a deeper corrective phase.
🧐 What to Watch in the Coming Weeks?
📈 Weekly closes relative to the EMA 200
💰 Volume behavior on down candles versus recovery attempts
🔄 Failure or reclaim of the 78,500 resistance zone
A failure to reclaim resistance with declining volume would confirm distribution. A reclaim with strong participation would invalidate the bearish thesis.
Until one of these conditions is met, capital preservation remains the priority.
📜 Disclaimer
This analysis is for informational and educational purposes only and should not be considered financial advice. Trading and investing in cryptocurrencies involve a high level of risk, and past performance is not indicative of future results. Always conduct your own research and consult with a professional financial advisor before making any investment decisions. The information provided here reflects market conditions at the time of writing and may change without notice. Neither the author nor this platform is responsible for any financial losses incurred as a result of trading decisions based on this analysis.