


The TOTAL2 index, which tracks the market capitalization of altcoins excluding Bitcoin, is currently navigating a key technical phase. Over the next three months, the market’s trajectory will be shaped by both technical signals and macroeconomic trends, such as the potential gradual decline in inflation and interest rate cuts by central banks. These factors could support risk-on assets like cryptocurrencies, but the technical picture still presents key resistance levels that need to be reclaimed before confirming a full bullish trend.
🔍 Weekly Chart Overview: Testing Key Long-Term Support
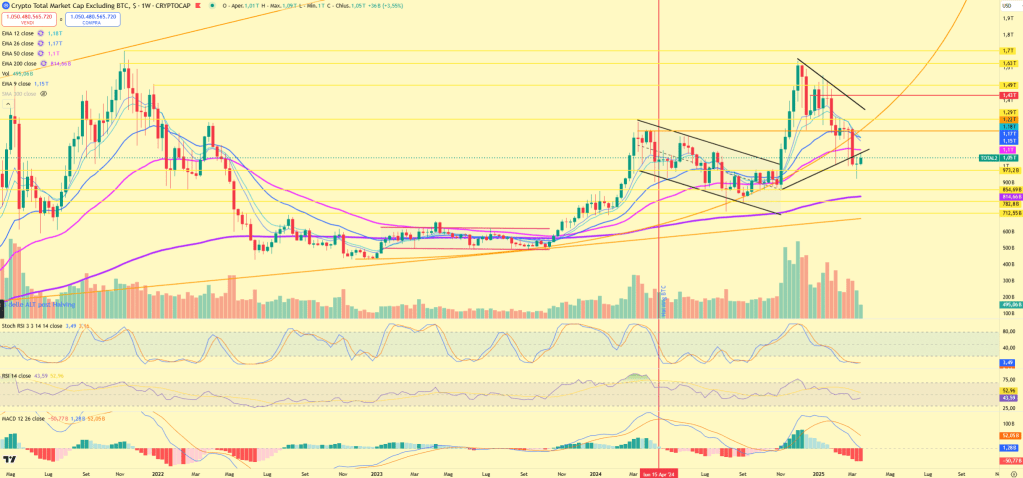
On the weekly timeframe, the altcoin market has been consolidating after a strong upward rally, forming a descending wedge pattern. This structure, historically, leans toward a bullish breakout, but confirmation is still needed.
- The market recently bounced off a major ascending trendline, which has acted as long-term support since mid-2022. This suggests that buyers are still stepping in at key levels.
- The 200-week EMA ($1.17T) is acting as a strong resistance, which needs to be reclaimed for further upside momentum.
- Volume analysis indicates that, despite recent price corrections, selling pressure has not intensified significantly, hinting at potential accumulation rather than full distribution.
If TOTAL2 can break above $1.17T and hold that level, it would signal a shift toward a more bullish mid-term trend, allowing altcoins to recover more strongly.
📈 Daily Chart: Short-Term Rebound, But Key Resistance Remains

Looking at the daily timeframe, the market has made an attempt to recover after a corrective phase but still faces resistance at descending trendlines.
- The 50-day EMA and 100-day EMA are compressing, which often precedes a momentum shift—either a breakout or further downside.
- Stock RSI and MACD are turning upward, indicating short-term bullish momentum, but need confirmation on price action.
- The psychological level of $1.05T is currently holding as support, with a strong liquidity zone just below it, around $990B-$1.0T.
A sustained breakout above $1.17T would mark the start of a stronger bullish recovery, while failure to reclaim that level could lead to a prolonged consolidation phase.
📊 Mid-Term Trend Outlook (April – June 2025)
Based on historical price action and technical indicators, the likely scenarios for TOTAL2 over the next 3 months are:
📈 Bullish Scenario (Higher Probability If Market Reclaims $1.17T-$1.21T)
- A confirmed breakout above $1.17T would open the door for a recovery toward $1.31T-$1.45T, representing a 20-30% upside for altcoins.
- Gradual macroeconomic improvement, such as lower inflation and potential rate cuts, could favor a return to risk assets, increasing liquidity inflows into the altcoin market.
- A breakout from the descending wedge on the weekly chart would align with past altcoin market recoveries seen in previous cycles.
📉 Bearish/Neutral Scenario (If Market Fails to Break Resistance)
- If TOTAL2 fails to break above $1.17T, the market could remain in a sideways range, fluctuating between $990B – $1.17T.
- Further downside is possible if macroeconomic conditions worsen, but the ascending trendline should act as strong support, preventing deeper corrections.
- A retest of $900B-$950B remains a possibility before a stronger bullish breakout can materialize.
🔮 Final Considerations
In the next three months, the altcoin market’s mid-term trend will depend on whether TOTAL2 can break above the key resistance at $1.17T or remains trapped in its current range. While technical indicators suggest a potential recovery, confirmation is still needed.
From a macro perspective, the expectation of lower inflation and rate cuts could act as a catalyst for altcoin growth. However, traders and investors should monitor price action closely, as market structure shifts will provide key signals for the next phase of the cycle.
📜 Disclaimer
This analysis is for informational and educational purposes only and should not be considered financial advice. Trading and investing in cryptocurrencies involve a high level of risk, and past performance is not indicative of future results. Always conduct your own research and consult with a professional financial advisor before making any investment decisions. The information provided here reflects market conditions at the time of writing and may change without notice. Neither the author nor this platform is responsible for any financial losses incurred as a result of trading decisions based on this analysis.
Start Free Today. Unlock Your 15% Member Discount.
Access the Free Start program immediately and receive an exclusive 15% discount for your first Learning Path purchase.
Build your foundation before making your next investment decision.


