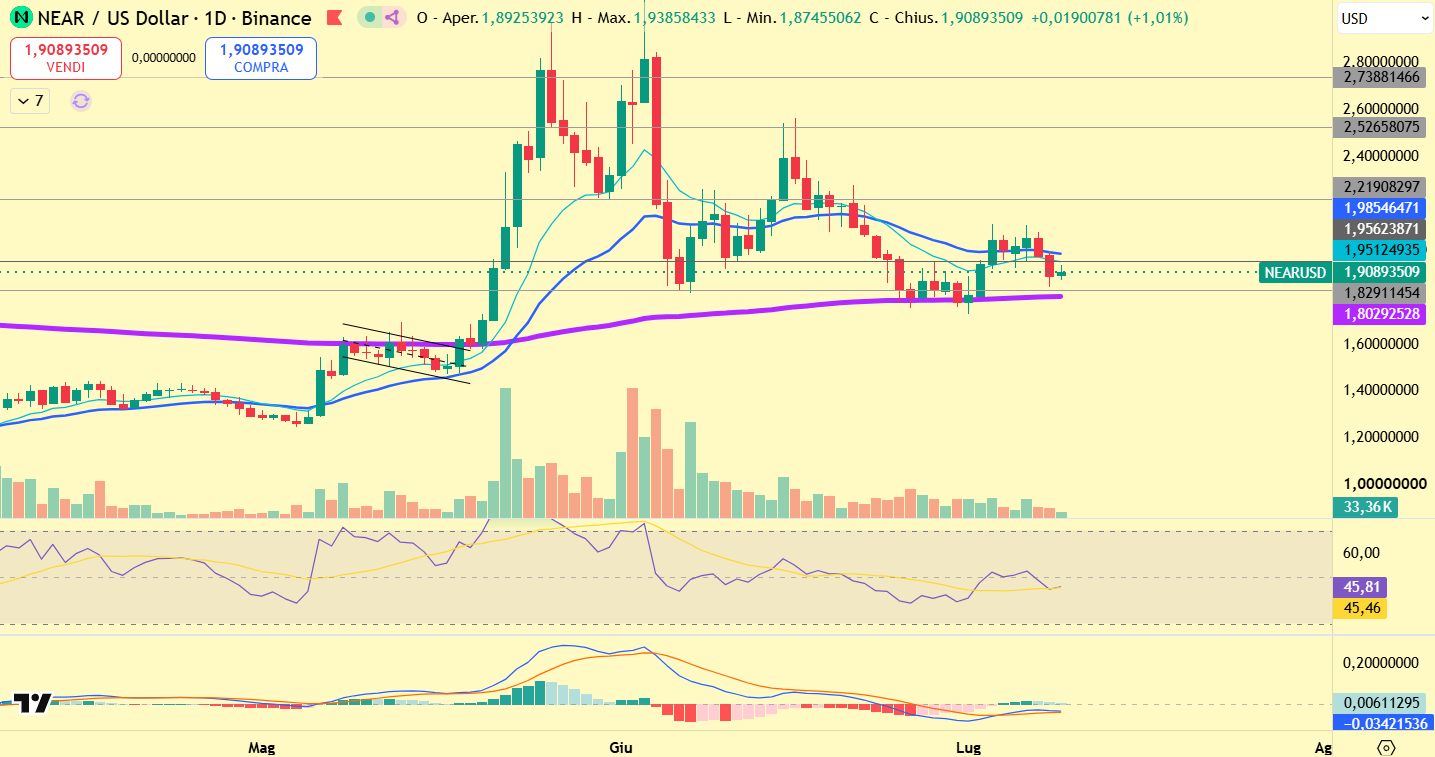
🔍 Key Levels and Current Structure
NEAR Protocol is entering one of those technical phases where the chart appears relatively quiet on the surface, yet the underlying structure is becoming increasingly important. On the daily chart, $NEAR is currently trading around $1.91, positioned between two very different technical forces. Above price, a dense resistance cluster around $1.95 to $1.99 continues to suppress recovery attempts. Below price, the market is approaching a major structural support region between approximately $1.83 and $1.80, reinforced by the long-term moving average visible on the chart.
This creates a compressed technical environment.
The market is not currently in a clean bullish continuation. It is not yet in a confirmed bearish breakdown either. Instead, price is being squeezed between a deteriorating short-term structure and a still-defended long-term support area. That distinction matters because the next decisive movement may determine whether the recent stabilization develops into a meaningful accumulation phase or simply becomes another temporary pause inside a broader corrective sequence.
The most important levels visible on the chart are:
🔴 Major resistance: $2.7388
🔴 Upper resistance: $2.5266
🔴 Structural resistance: $2.2191
🟠 Immediate resistance cluster: $1.9512 to $1.9855
🟢 Current price area: approximately $1.9089
🟢 Primary horizontal support: $1.8291
🟢 Major dynamic support: approximately $1.8029
These levels define the technical battlefield.
The immediate issue for bulls is simple: NEAR remains below the short-term moving average cluster. Price is trading beneath both dynamic references visible around approximately $1.95 and $1.99, meaning the latest rebound has not yet restored bullish control. At the same time, bears have also failed to generate a decisive breakdown beneath the broader support zone around $1.80 to $1.83.
The result is compression.
And compression should never be confused with strength.
A market can consolidate before moving higher, but it can also consolidate because sellers are temporarily pausing before the next leg lower. The task of technical analysis is therefore not to guess which narrative feels more attractive. It is to identify which levels would confirm one scenario and invalidate the other.
At this moment, the chart suggests that NEAR remains technically vulnerable, but the vulnerability is not yet equivalent to a confirmed bearish continuation.
📉 The Daily Structure Has Lost Momentum After the Explosive Recovery
To understand the current situation, we need to step back and examine how NEAR arrived here.
The left side of the chart shows a period of prolonged weakness followed by a significant bullish expansion. Price accelerated rapidly from the lower region of the chart, breaking out of a previous consolidation and generating a strong momentum phase. That move eventually pushed NEAR toward the $2.50 to $2.74 area, where the market encountered substantial supply.
The rally was powerful, but it was also unstable.
This is visible in several ways.
First, the advance became increasingly vertical. Sharp vertical expansions can produce substantial returns, but they also tend to create weak structural foundations because price moves faster than the market can build sustainable support underneath. Instead of progressing through a sequence of controlled higher highs and higher lows, NEAR experienced an aggressive repricing followed by equally aggressive volatility.
Second, volume expanded dramatically during the strongest part of the move. That confirmed genuine participation, but the subsequent inability to maintain price above the upper resistance zone suggests that the market could not transform that participation into durable continuation.
Third, after the peak, price entered a broad corrective process.
The chart shows a clear sequence of failed attempts to preserve the strongest bullish momentum. NEAR initially fell sharply from the highs, rebounded, then experienced further instability. Eventually, the market lost the ability to remain above the $2.2191 structural level, which is now one of the most important references on the entire chart.
That loss changed the technical environment.
Above $2.2191, the market would have had a stronger argument for rebuilding a medium-term bullish structure. Below it, the chart remains trapped in a lower-value zone where rallies can still function as corrective rebounds rather than genuine trend reversals.
The current price near $1.91 is therefore not merely “slightly below resistance.” It is positioned inside a broader structure that has already experienced a substantial deterioration from the previous peak.
This is why the market needs confirmation.
A bounce alone is not enough.
⚠️ The Immediate Resistance Cluster Is the First Test Bulls Must Pass
The most important short-term obstacle is the zone between approximately $1.95 and $1.99.
This area combines several technical elements.
Price is currently below the short-term dynamic averages visible on the chart. One is positioned around $1.951, while another sits closer to $1.985. Regardless of the exact moving-average configuration used, the message is technically clear: the market is trading beneath a cluster of dynamic resistance.
That creates a problem for buyers.
Whenever price remains below declining or flattening short-term moving averages, rebounds can repeatedly attract supply. Traders who bought previous rallies may use those recoveries to reduce exposure. Short sellers may view the same area as a favorable risk-defined location. Momentum traders may refuse to enter until price proves it can close above the cluster.
Therefore, $1.95 to $1.99 is not a minor technical detail. It is the first zone that separates a weak recovery from a potentially meaningful structural improvement.
A daily close above approximately $1.99, followed by a successful retest, would represent an important change.
It would suggest that:
- sellers are losing control of the immediate recovery zone;
- price has reclaimed the short-term dynamic structure;
- the market may be preparing to attack $2.2191;
- the recent weakness could be transforming into a broader base.
Without that reclaim, however, the chart remains vulnerable to another rotation lower.
This is one of the central points of the current analysis: bulls do not need to immediately return to $2.50 or $2.74 to improve the chart. They first need to prove they can recover $1.95 to $1.99.
Until that happens, optimism remains premature.
🧱 The $1.83 to $1.80 Zone Is the Real Defensive Line
The most important support area is located between approximately $1.8291 and $1.8029.
This zone deserves particular attention because it combines horizontal structure with long-term dynamic support.
The horizontal level around $1.829 has already acted as an important market reference. Price previously interacted with this region during the corrective sequence, and recent weakness has again brought the market close to it.
Immediately below, the thick long-term moving average visible around $1.803 creates an additional layer of technical significance.
This combination makes the entire $1.80 to $1.83 region a genuine decision zone.
A test of this area could produce one of three outcomes.
The first is a strong bullish rejection. Price trades into support, sellers fail to continue, buyers absorb supply, and NEAR closes back above the zone with a visible rejection wick or bullish reversal candle. That would strengthen the argument for a new recovery attempt.
The second is prolonged consolidation directly above support. This would be more ambiguous. A base can develop there, but repeated tests of support can also weaken the level over time.
The third is a decisive daily breakdown below $1.80. That would materially damage the chart because the market would lose both horizontal and dynamic support simultaneously.
This is why the current position around $1.91 should not be evaluated in isolation.
NEAR is less than one meaningful daily movement away from a major technical test.
📊 The Long-Term Moving Average Is Preventing a Fully Bearish Reading
One reason we should avoid declaring the chart completely bearish is the behavior around the long-term moving average.
The thick purple average visible on the chart sits around $1.80, and price remains above it.
This matters.
A market trading below short-term averages but above a major long-term average often represents a transitional structure. Short-term momentum has deteriorated, yet the broader trend has not necessarily collapsed.
In practical terms, the market is saying two things simultaneously:
“Buyers are not currently strong enough to control the short-term trend.”
But also:
“Sellers have not yet proven they can destroy the broader structural floor.”
That tension defines the current setup.
If NEAR rebounds from the long-term average and subsequently reclaims the short-term moving-average cluster, the present weakness could later be interpreted as a constructive retest.
If NEAR loses the long-term average decisively, the interpretation changes completely. The same consolidation that currently appears potentially constructive would begin to look like distribution or failed stabilization.
This is why technical analysis must remain conditional.
We do not need to predict the future with certainty. We need to define exactly what the market must do to confirm each scenario.
📉 The Sequence of Highs Still Favors Caution
Another reason for maintaining a cautious bias is the evolution of the swing structure.
Following the major rally toward the upper resistance zone, NEAR failed to preserve a clean sequence of higher highs. Instead, each subsequent recovery became less convincing.
The chart shows significant rejection from the peak near the upper $2.70 region. A later rally attempted to recover, but it remained below the strongest previous high. Another rebound toward the mid-$2.00 region also failed to create sustainable continuation.
More recently, the market recovered from the $1.80 area but again struggled near the $2.00 region.
This matters because trend analysis is fundamentally about the relationship between highs and lows.
A bullish market should eventually prove that buyers can push price beyond previous supply zones.
A bearish or corrective market repeatedly fails to do so.
At present, NEAR has not yet demonstrated a convincing reversal of the sequence that developed after the major peak. The latest rebound was useful, but it was not sufficient.
For a stronger bullish interpretation, we would ideally want to see:
a sustained reclaim of $1.99;
a higher low above the $1.80 support region;
a breakout above $2.2191;
and eventually a renewed attack on $2.5266.
Until at least the first two conditions begin to appear, the chart remains technically fragile.
📈 RSI: Momentum Is Neutral, but Still Below the Bullish Threshold
The RSI displayed on the chart is around 45.81, while its smoothing reference sits near 45.46.
This is a particularly interesting configuration because it confirms the absence of strong directional momentum.
The RSI is not oversold.
Therefore, we cannot argue that NEAR is currently experiencing an extreme downside condition that automatically favors a powerful mean-reversion bounce.
At the same time, RSI is not deeply weak either.
The indicator is sitting in a neutral-to-soft region, slightly below the important 50 threshold. This supports the idea that sellers retain a modest momentum advantage, but not overwhelming control.
The 50 level is critical in this context.
If price reclaims the $1.95 to $1.99 resistance cluster while RSI simultaneously moves decisively above 50, the bullish signal would become substantially stronger. That would represent alignment between price structure and momentum.
Conversely, if RSI rolls over from the current region and begins moving toward the lower part of its range while price attacks $1.83, downside pressure would become more credible.
The present RSI configuration therefore supports neither an aggressive long nor an aggressive short at market.
Instead, it supports patience.
Momentum is waiting for confirmation just as price is waiting for confirmation.
📉 MACD: The Recovery Attempt Is Losing Energy
The MACD structure reinforces the cautious interpretation.
At the bottom of the chart, the indicator shows that the previous bearish momentum phase weakened and a recovery attempt developed. However, the latest configuration appears increasingly flat. The lines are close together, momentum is modest, and the histogram is hovering near the equilibrium region rather than expanding powerfully in either direction.
This tells us something important.
The rebound from the major support zone did not create strong sustained momentum.
A genuinely powerful bullish reversal would ideally generate:
expanding positive histogram bars;
clear separation between the MACD and signal lines;
rising momentum while price attacks resistance;
and confirmation from volume.
That is not what the chart currently shows.
Instead, the MACD is suggesting hesitation.
This does not guarantee a bearish breakdown, but it reduces the credibility of the argument that NEAR is already beginning a major new bullish phase.
The indicator is effectively confirming the same message visible in price action: the market is compressing, and the last rebound has not yet developed enough energy to dominate the structure.
📦 Volume Is One of the Biggest Weaknesses in the Current Recovery
Volume deserves significant attention because it helps distinguish genuine conviction from temporary price movement.
The strongest bullish expansion on the chart was accompanied by substantial increases in volume. That is exactly what we would expect during an important repricing event.
However, recent activity has been much more subdued.
The latest rebound from the support region toward the $2.00 area did not generate anything comparable to the participation seen during the earlier expansion. More importantly, as price now trades around $1.91, volume appears to be declining.
This creates two possible interpretations.
The constructive interpretation is that sellers are losing aggression. If price can remain above support while volume contracts, the market may be entering a controlled accumulation phase.
The bearish interpretation is that buyers simply lack commitment. The rebound occurred, but insufficient demand emerged to push price through the resistance cluster.
At present, the second interpretation deserves slightly more weight because price has failed to reclaim the key dynamic resistance area.
But volume alone cannot settle the question.
The next expansion will be critical.
A breakout above $1.99 with strong volume would materially improve the bullish scenario.
A breakdown below $1.80 with expanding volume would strongly validate the bearish scenario.
A breakout in either direction without volume would be more vulnerable to failure.
🟢 Bullish Scenario: NEAR Defends Major Support and Reclaims $2.00
The first major scenario is bullish, but it requires confirmation.
For this scenario to develop, NEAR does not need to explode immediately toward the previous highs. The market first needs to stabilize the current structure.
The ideal bullish sequence would be:
price holds above $1.83 to $1.80;
buyers defend the long-term moving average;
the market forms a higher low or a strong rejection candle;
NEAR reclaims $1.95;
price closes above approximately $1.985 to $2.00;
and the reclaimed zone then holds as support.
This would be a meaningful structural improvement.
The first major upside target would then become $2.2191.
That level is extremely important because it represents more than a simple horizontal resistance. Recovering it would indicate that the market is beginning to reverse a larger portion of the corrective structure.
Above $2.2191, the next major target would be approximately $2.5266.
If momentum becomes genuinely strong and volume expands, the market could eventually revisit the upper resistance around $2.7388.
However, we should not skip intermediate confirmation.
A common analytical mistake is to see a support bounce and immediately project the old high. That ignores the resistance architecture between current price and the target.
For NEAR, the bullish path is not:
$1.91 → $2.74.
The realistic bullish path is:
$1.91 → reclaim $1.95 to $1.99 → attack $2.219 → consolidate or retest → target $2.526 → potentially challenge $2.739.
Each level must be earned.
🟢 Long Setup 1: Aggressive Support Reversal
The first potential long strategy is an aggressive support-based setup.
This is suitable only if NEAR returns toward the major $1.83 to $1.80 zone and produces clear evidence that buyers are defending it.
A possible execution framework could be:
Potential entry area: approximately $1.81 to $1.86
Required confirmation: bullish rejection, failed breakdown, reclaim candle, or visible reversal structure
Invalidation area: below approximately $1.76 to $1.78, depending on volatility and execution style
First target: $1.95
Second target: $1.985 to $2.00
Third target: $2.219
Extended target: $2.526
This setup offers potentially attractive risk-to-reward because entry occurs near major support.
However, it carries substantial risk.
The danger is obvious: buying support before confirmation can become buying directly into a breakdown.
Therefore, the key is not merely reaching $1.80.
The key is how price behaves there.
A strong wick below support followed by a daily recovery could be constructive. A bullish engulfing pattern could be constructive. A failed breakdown followed by a reclaim could be constructive.
A full-bodied daily candle closing decisively beneath $1.80 would not be constructive.
The long thesis depends on support surviving.
🟢 Long Setup 2: Confirmed Reclaim Above the Resistance Cluster
The second long setup is more conservative and, in my view, technically cleaner.
Instead of buying near support, the trader waits for NEAR to prove that the short-term structure has changed.
The key trigger would be a decisive daily reclaim of the $1.985 to $2.00 area.
A possible framework:
Trigger: daily close above approximately $1.99 to $2.00
Preferred execution: breakout followed by successful retest
Potential entry: approximately $1.97 to $2.03, depending on the retest structure
Invalidation: loss of the reclaimed zone, potentially below $1.90 or beneath the specific retest low
First target: $2.219
Second target: $2.5266
Third target: $2.7388
This setup sacrifices entry price in exchange for confirmation.
That is often a worthwhile trade-off.
At present, NEAR is below the resistance cluster. Buying now assumes the reclaim will occur.
Waiting for confirmation means entering only after the market has shown that buyers can actually absorb supply.
The drawback is that false breakouts remain possible. This is why a simple intraday spike above $2.00 should not automatically be treated as confirmation.
A stronger signal would involve:
a daily close above resistance;
increased volume;
RSI recovering above 50;
MACD improving;
and ideally a retest that holds.
The more factors align, the stronger the setup.
🟢 Long Setup 3: Structural Breakout Above $2.219
A third bullish setup exists for traders who prioritize trend confirmation over early positioning.
This setup would only become relevant if NEAR decisively reclaims $2.2191.
A move above this level would materially alter the structure because it would indicate that buyers have not only recovered the short-term moving averages but also broken through an important horizontal barrier.
Potential framework:
Trigger: confirmed daily close above $2.219
Preferred entry: successful retest between approximately $2.18 and $2.23
Invalidation: failed reclaim and close back beneath the breakout structure
First target: $2.5266
Second target: $2.7388
Extended scenario: price discovery toward higher levels only after the upper resistance is resolved
This would be the strongest bullish confirmation among the three long scenarios.
It would also offer a less favorable entry price.
That is the permanent trade-off in technical trading: early entries offer greater potential reward but lower confirmation; later entries offer stronger confirmation but less distance to the next resistance.
🔴 Bearish Scenario: Rejection Continues and Major Support Breaks
The bearish scenario begins from the observation that NEAR remains below the immediate resistance cluster and has not yet demonstrated enough momentum to reverse the broader corrective structure.
The first bearish development would be continued rejection below $1.95 to $1.99.
If price repeatedly attempts to recover this zone and fails, sellers may gradually regain control.
A move back toward $1.8291 would then become increasingly likely.
The critical event would be a daily breakdown beneath approximately $1.80.
Such a move would be technically significant because it would represent the simultaneous loss of:
horizontal support;
the long-term dynamic average;
the recent stabilization structure;
and the principal defensive zone visible on the chart.
This would not be an ordinary minor breakdown.
It would suggest that the market has failed to convert the previous support test into a sustainable base.
In that scenario, attention would shift toward lower historical structure visible on the chart. The first potential areas of interest would likely emerge around the $1.70 to $1.60 region, with deeper downside risk toward prior consolidation zones if selling accelerates.
We should be precise here: those lower targets are less clearly defined than the marked levels at $1.829 and $1.803. Therefore, they should be treated as broader zones rather than exact levels.
The strongest bearish confirmation would involve:
daily close below $1.80;
rising sell volume;
RSI falling decisively below its current neutral region;
MACD expanding negatively;
and a failed retest of $1.80 from below.
That combination would produce a substantially cleaner bearish setup.
🔴 Short Setup 1: Rejection From $1.95 to $1.99
The first possible short strategy is based on continued rejection from the immediate resistance cluster.
This setup is particularly relevant because the market is already trading below that area.
A possible framework:
Potential entry zone: approximately $1.95 to $1.99
Required confirmation: bearish rejection candle, failed reclaim, lower high, or breakdown after testing the zone
Potential invalidation: above approximately $2.03 to $2.06, depending on volatility
First target: $1.829
Second target: $1.803
Extended target: $1.70 to $1.60 if support breaks
This setup offers an advantage: the resistance is clearly defined.
But it also carries a significant risk.
If NEAR reclaims $2.00 with conviction, the short thesis rapidly weakens. A trader remaining short after a successful breakout could become trapped as the market moves toward $2.219.
Therefore, this is not a “short because price is below $2.00” setup.
It is a short only if price actively demonstrates rejection.
Confirmation matters.
🔴 Short Setup 2: Confirmed Breakdown Below $1.80
The second bearish setup is structurally stronger.
Instead of anticipating failure, the trader waits for the market to lose major support.
Potential framework:
Trigger: decisive daily close below approximately $1.80
Preferred execution: failed retest of $1.80 to $1.83 from below
Potential entry: approximately $1.79 to $1.83 after bearish confirmation
Invalidation: recovery above the failed retest structure, potentially around $1.86 to $1.89
First target: approximately $1.70
Second target: approximately $1.60
Extended target: lower historical base areas if momentum accelerates
This setup is technically attractive because the invalidation can be clearly defined.
The best version of the trade would not involve chasing a large red candle lower.
Instead, the ideal sequence would be:
support breaks;
price closes below it;
market rebounds;
former support becomes resistance;
sellers reappear;
downside continuation begins.
That failed-retest structure is often much cleaner than entering immediately during the initial breakdown.
🔴 Short Setup 3: Failed Breakout Above $2.00
There is also a third bearish possibility that deserves attention.
NEAR could temporarily move above $2.00, attract breakout buyers, and then fail.
A false breakout would be particularly significant because the current resistance cluster is already obvious. Many traders may be watching the same region.
A possible sequence:
price trades above $1.99;
bullish sentiment improves;
the market fails to sustain the move;
NEAR closes back below $1.95;
the breakout becomes trapped;
selling accelerates toward $1.83.
This could create a high-quality short setup because failed breakouts often generate forced repositioning.
The key distinction would be between a genuine reclaim and a liquidity sweep.
A genuine reclaim holds above resistance.
A failed breakout rapidly returns beneath it.
The market’s behavior after crossing $2.00 may therefore be more informative than the breakout itself.
⚖️ Scenario Probability: What Is the Most Likely Outcome?
Based exclusively on the daily chart provided, my current view is that the most probable immediate scenario is continued compression with a mild bearish bias, followed by another test of the $1.83 to $1.80 support zone before a larger directional decision.
This is not an aggressive bearish prediction.
It is a probability assessment.
Several factors support it.
First, price remains below the short-term moving-average cluster around $1.95 to $1.99.
Second, the latest recovery attempt has failed to generate sustained continuation.
Third, RSI remains below 50, indicating that bullish momentum has not yet regained control.
Fourth, MACD momentum appears weak and compressed rather than strongly positive.
Fifth, volume has declined, suggesting a lack of conviction behind the current rebound.
Sixth, the market continues to trade relatively close to major support, making another test technically plausible.
For these reasons, I currently see a direct breakout toward $2.219 as less probable than either continued sideways movement or a rotation back toward the lower support zone.
My approximate qualitative probability framework would be:
45% probability: continued compression followed by a test of $1.83 to $1.80, with support initially holding.
30% probability: bullish reclaim of $1.99 to $2.00, opening the path toward $2.219.
25% probability: decisive breakdown below $1.80, producing a new bearish expansion.
These probabilities are not mathematical forecasts. They are a way to express the relative weight I currently assign to the visible scenarios.
The important point is that my base case is not an immediate collapse.
I believe the market is more likely to test support before deciding.
That distinction matters.
A support test can become the foundation for a long setup.
A support breakdown can become the trigger for a short setup.
The same movement toward $1.80 can therefore precede completely different trades depending on the reaction.
🧠 Why I Would Not Enter Aggressively at the Current Price
At approximately $1.91, NEAR is positioned in an uncomfortable area for both long and short entries.
For a long position, price is still below resistance.
Buying here means entering before the market has proven it can reclaim $1.95 to $1.99.
For a short position, price is already relatively close to major support.
Selling aggressively at $1.91 means accepting that the market could soon encounter substantial demand around $1.83 to $1.80.
This creates poor location.
The best trades usually emerge when the market approaches a level that clearly defines both thesis and invalidation.
At $1.91, neither side has ideal asymmetry.
A long near $1.82 with confirmed rejection could offer a much clearer invalidation.
A long above $2.00 after a confirmed reclaim could offer a stronger momentum thesis.
A short near $1.98 after visible rejection could offer a defined resistance-based invalidation.
A short below $1.80 after a failed retest could offer a defined breakdown thesis.
The current midpoint is less attractive.
Sometimes the best technical decision is not to predict more aggressively. It is to wait for price to move into a better decision zone.
🔄 The Range Between $1.80 and $2.00 Is the Immediate Battlefield
From a tactical perspective, the current market can be simplified into a relatively clear range.
The lower boundary is approximately $1.80 to $1.83.
The upper boundary is approximately $1.95 to $2.00.
Inside this range, price is vulnerable to noise.
Breakouts can fail.
Momentum signals can reverse.
Short-term candles can produce misleading direction.
This is why traders should distinguish between movement inside the range and acceptance outside the range.
A candle above $2.00 is not automatically a breakout.
A candle below $1.80 is not automatically a breakdown.
What matters is whether price is accepted there.
Acceptance above $2.00 would improve the bullish scenario.
Acceptance below $1.80 would improve the bearish scenario.
Repeated rejection from both boundaries would reinforce the sideways compression thesis.
The longer this range persists, the more important the eventual resolution may become.
🧩 The $2.219 Level Is the Real Medium-Term Bullish Confirmation
Although the immediate focus is on $2.00, the most important medium-term upside level remains $2.2191.
Why?
Because reclaiming $2.00 would improve short-term momentum.
Reclaiming $2.219 would improve the broader structure.
There is a difference.
A move above the moving averages could simply create a rebound.
A sustained move above $2.219 would suggest that the market is beginning to reverse a more significant portion of the post-peak decline.
This would increase the probability of a move toward $2.5266.
It would also begin to weaken the bearish sequence of failed recoveries.
Therefore, traders should avoid treating $2.00 as the final bullish confirmation.
It is only the first door.
$2.219 is the second and more important door.
🚨 What Would Completely Invalidate the Bullish Thesis?
The bullish thesis would suffer major damage under a decisive daily breakdown below $1.80.
Not a brief intraday wick.
Not a marginal liquidity sweep.
A genuine breakdown with acceptance below support.
The strongest invalidation would involve:
a full-bodied daily close beneath $1.80;
increased volume;
failed recovery on the next sessions;
$1.80 becoming resistance;
and momentum indicators deteriorating simultaneously.
That would suggest that the long-term moving average has failed as support and the recent base has broken.
At that point, continuing to describe the structure as “bullish accumulation” would become increasingly difficult to defend.
Technical analysis requires intellectual flexibility.
A thesis is useful only while the market respects the conditions supporting it.
🚀 What Would Completely Invalidate the Bearish Thesis?
The bearish thesis would weaken substantially if NEAR reclaims $1.99 to $2.00 and then holds the zone.
It would weaken even more above $2.219.
A strong bullish sequence would involve:
daily close above $2.00;
successful retest;
rising volume;
RSI above 50;
MACD expansion;
break above $2.219;
and higher low formation.
If that occurs, continuing to short the market based solely on previous weakness would become increasingly dangerous.
Above $2.219, the probability of a move toward $2.5266 would rise materially.
Above $2.5266, the entire medium-term interpretation would need to be reassessed again.
📌 Risk Management Matters More Than the Directional Prediction
This NEAR chart is an excellent example of why risk management is more important than pretending to know the future.
The market is currently between major levels.
That means uncertainty is elevated.
A trader can build a bullish thesis and still be wrong.
A trader can build a bearish thesis and still be wrong.
The objective is not to eliminate uncertainty. That is impossible.
The objective is to structure exposure so that being wrong does not become catastrophic.
For support longs, invalidation should exist below the support structure.
For breakout longs, invalidation should exist below the reclaimed zone or retest low.
For resistance shorts, invalidation should exist above the rejection structure.
For breakdown shorts, invalidation should exist above the failed retest.
The exact stop distance depends on execution timeframe, volatility, position size and strategy design. But the principle remains constant:
the stop should invalidate the thesis, not merely reflect an arbitrary percentage.
Position size should then be calculated around that invalidation.
This is especially important in crypto markets, where daily volatility can be substantial and poorly positioned leverage can convert a reasonable analysis into a disastrous trade.
🧭 Final Technical Outlook
NEAR Protocol is currently sitting inside a technically important compression phase.
The chart is neither cleanly bullish nor fully bearish.
The short-term structure remains weak because price is trading beneath the resistance cluster around $1.95 to $1.99. The latest recovery has failed to generate convincing continuation, RSI remains below 50, MACD momentum is subdued, and volume does not currently show strong bullish conviction.
These factors justify caution.
However, the broader structure has not yet collapsed.
The market remains above the major support zone around $1.83 to $1.80, including the long-term dynamic average visible near $1.803. As long as this region survives, the possibility of a larger base remains valid.
My preferred interpretation is therefore:
short-term neutral to mildly bearish; medium-term undecided; major decision likely around $1.80 support or a confirmed reclaim above $2.00.
The most probable immediate scenario, in my view, is continued compression followed by another test of the $1.83 to $1.80 zone.
That test could become the decisive moment.
A strong rejection would create one of the most interesting long opportunities on the chart.
A daily breakdown followed by a failed retest would create one of the clearest short opportunities.
For bulls, the roadmap is:
defend $1.83 to $1.80 → reclaim $1.95 to $2.00 → attack $2.219 → target $2.5266 → potentially revisit $2.7388.
For bears, the roadmap is:
reject $1.95 to $1.99 → pressure $1.83 → break $1.80 → confirm failed retest → target lower structural regions around $1.70 and $1.60.
At the current price near $1.91, I would personally avoid forcing an aggressive directional position.
The chart is offering better potential locations on both sides.
The next significant signal will likely come from one of two events:
a confirmed reclaim above $1.99 to $2.00, or a confirmed breakdown below $1.80.
Until then, the market remains trapped between short-term weakness and long-term support.
And that is precisely why the next move matters so much.
⚠️ Disclaimer
This technical analysis is provided for educational and informational purposes only and does not constitute financial advice, investment advice, trading advice, or a recommendation to buy or sell NEAR Protocol or any other financial asset. Cryptocurrency markets are highly volatile and involve substantial risk of loss. Technical levels, scenarios, probabilities, long setups, short setups, entry zones, stop-loss areas and targets discussed in this analysis are hypothetical frameworks based exclusively on the chart provided and may fail without warning. Always conduct your own research, consider your personal financial situation, use appropriate risk management, and never risk capital you cannot afford to lose.
Start Free Today. Unlock Your 15% Member Discount.
Access the Free Start program immediately and receive an exclusive 15% discount for your first Learning Path purchase.
Build your foundation before making your next investment decision.