BNB technical analysis is pressing into a decisive $774–$781 resistance zone after a strong thirty-day advance. The latest completed BNB/USDT daily candle opened at $761.32, reached $773.76, traded down to $757.06 and closed at $762.02. That close was almost unchanged from the previous session, but it preserved most of the September 18 expansion and left price above the 20-day, 50-day and 200-day exponential moving averages. RSI 14 finished at 65.49, while MACD remained positive but slipped just below its signal line. The structure is therefore constructive without being confirmed: buyers have momentum and trend support, yet the September 5 high at $780.64 still defines the breakout that matters.
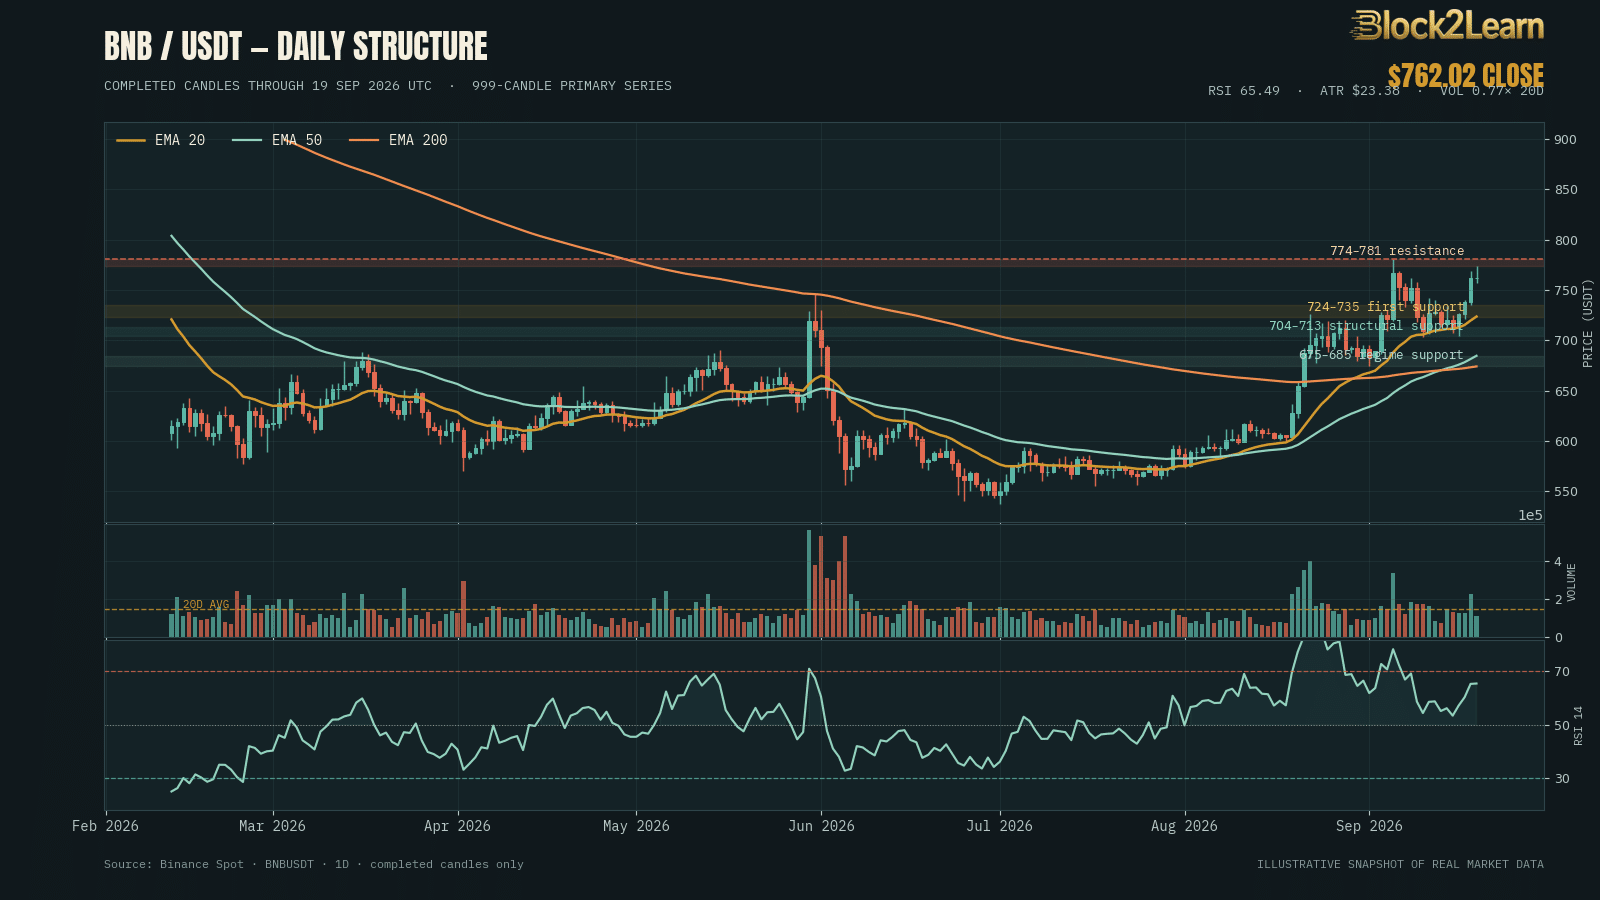
The still-forming September 20 candle was near $749.84 at the observation, after trading between $745.90 and $764.28. Binance’s five-minute weighted average was approximately $750.33. That live movement is separated from every completed-candle indicator in this analysis. Alpaca returned no BNB/USD record, and the public CoinGecko route was unavailable, so the live quote was reconciled through two native Binance endpoints rather than presented as an independent-venue validation. The immediate question is whether the current pullback is a normal retest above the $735 breakout shelf or the beginning of another rejection from $780. A completed close above $780.64 would confirm price discovery. A close below the $723.53 EMA 20 would return BNB to range conditions.

🔍 The levels that define the BNB decision
The primary resistance zone runs from roughly $774 to $780.64. Its lower edge combines the upper Bollinger Band near $774.06 with the September 19 high at $773.76. Its upper edge is the September 5 swing high. Those references are close enough to function as one supply shelf. A brief intraday trade through $774 would not settle the structure because BNB has already shown that it can move rapidly inside a daily range. The higher-quality signal would be a completed close above $780.64, followed by a retest that holds the $774–$781 zone as support.
The first support band is $735–$724. The $735.22 low of the September 18 expansion candle anchors the upper edge, while EMA 20 stands at $723.53. Price can pull back through the middle of this band without breaking the trend. What matters is the reaction: a higher daily low, RSI remaining above 50 and contracting volume would support the idea that sellers are taking profits rather than reversing the move. Repeated closes below EMA 20 would remove that interpretation and turn the band back into overhead resistance.
The next structural support is $713–$704. It contains several September lows, including $713.10 on September 13, $707.04 on September 15 and $704.29 on September 16. This cluster is more important than any single print because it marks the base from which the latest advance accelerated. A breakdown through the zone would erase the higher-low sequence and expose the rising EMA 50 at $684.51. The broader regime band is $685–$675, where EMA 50 converges with the September 1 low at $674.60. EMA 200 is lower at $662.74, completing the long-term trend map.
| Zone | Technical role | Confirmation | Invalidation |
|---|---|---|---|
| $774–$781 | Primary resistance and breakout shelf | Daily close above $780.64, then a successful retest | Rejection followed by a close below $735 |
| $735–$724 | Breakout low and EMA 20 support | Higher low with RSI holding above 50 | Repeated closes below $723.53 |
| $713–$704 | September higher-low cluster | Fast defense and reclaim of $724 | Acceptance below $704 |
| $685–$675 | EMA 50 and September swing support | Regime defense with improving volume | Close below $674.60 |
| $662–$650 | EMA 200 and prior breakout region | Long-term support and reversal candle | Persistent closes below $650 |
📈 The dominant trend is bullish, but the market is extended
BNB has advanced 16.37% over the last thirty completed sessions and 4.73% over the last seven. The larger move began after the July 1 low at $537.25. Price stabilized through July, reclaimed $600 in August and then accelerated from $603.95 on August 19 to a $702.37 close on August 23. That sequence changed the character of the chart. BNB was no longer rotating around a falling equilibrium; it was establishing a higher range above the averages and forcing the averages themselves to turn upward.
The August advance did not move in a straight line. After reaching $726.08 on August 22, BNB consolidated between roughly $675 and $720. That pause built the support now visible near $704–$713 and allowed EMA 20 to catch up. The September 5 session then expanded to $780.64, but the market could not keep the entire move. Price retreated to $708.72 by September 10 before rebuilding. This failed first breakout matters because the current attempt is testing known supply, not empty space.
A bullish trend can absorb a failed breakout if the subsequent decline forms a higher low. That is what BNB has done so far. The September pullback held far above the July base, recovered through $724 and produced two strong sessions into September 18. The sequence of higher lows remains intact, and price is above all three exponential averages. The market is nevertheless extended relative to EMA 50 and EMA 200. At $762.02, BNB is about 11.3% above EMA 50 and 15.0% above EMA 200. Trend strength and entry quality are not the same thing; the first is positive, while the second demands patience near resistance.
📊 The moving averages define three different time horizons
EMA 20 is $723.53 and rising. It is the first trend gauge because it responds quickly to the August and September advance. The last completed close is 5.3% above it, a meaningful but manageable distance in a market whose fourteen-day ATR is 3.07% of price. A pullback toward EMA 20 would therefore require more than one ordinary daily range from the completed close, but it would not be exceptional. If price tests the average and buyers defend it, the trend would be rebalanced rather than broken.
EMA 50 is $684.51. Its slope has turned decisively higher after the August acceleration, and it now sits above EMA 200 at $662.74. That positive alignment supports the medium-term bullish case. The crossover is lagging evidence, not a fresh signal, but it confirms that recent gains are no longer isolated from the broader trend. If BNB loses EMA 20, the $675–$685 region becomes the more important regime test because it combines a moving average with visible horizontal support.
EMA 200 is the long-term boundary. BNB reclaimed it during August and has not yet returned for a full test. Markets often revisit major averages after a sharp escape, but they do not have to do so immediately. A healthy trend can continue building higher shelves while the average rises underneath. The warning would be a breakdown through EMA 50 followed by weak rallies that fail below $704–$713. That sequence would turn EMA 200 from distant background support into an active downside objective.
The order of the averages is therefore constructive: price above EMA 20, EMA 20 above EMA 50 and EMA 50 above EMA 200. The missing element is horizontal confirmation. Moving averages describe trend location; they cannot prove that supply at $780 has been absorbed. BNB needs both conditions—the positive hierarchy underneath and acceptance above the ceiling—to transition from a trend test into a confirmed breakout.
⚡ RSI is strong without being overbought
RSI 14 closed at 65.49. That is consistent with a bullish daily regime and remains below the conventional overbought threshold of 70. Momentum therefore supports another test of resistance without showing a fully exhausted condition. RSI also helps explain why the September 19 pause was not automatically bearish: price finished almost unchanged while momentum remained in the mid-60s, preserving the strength generated by the September 18 advance.
The comparison with September 5 is more important. BNB reached its $780.64 high during a rapid expansion, and momentum briefly pushed into a hotter zone. If price produces a marginal new high while RSI cannot recover toward its prior peak, the chart could form a negative divergence. A divergence is not a short signal by itself. It would mean that a breakout needs stronger evidence from volume, closing location and the retest because price is advancing with less internal force.
The bullish momentum condition is RSI holding above 60 during a close through $780.64, then resetting above 50 on any retest. The neutral condition is an RSI decline into the low 50s while price holds $724. The bearish combination is more specific: RSI below 50 at the same time BNB closes beneath EMA 20. When momentum and trend support fail together, the probability of a deeper move toward $704–$713 increases.
🔊 Volume has improved, but the latest pause was quieter
The September 18 expansion traded 226,366.59 BNB on Binance Spot. That was approximately 1.52 times the twenty-day average at the time and gave the move from $738.36 to $761.31 credible participation. The following session traded 114,202.51 BNB, only 0.77 times the current twenty-day average of 148,804.57. A low-volume pause after a stronger advance can be constructive because sellers are not overwhelming the market. It also means the breakout has not yet received a second wave of participation.
Volume should be evaluated as a sequence. The September 5 resistance test traded 337,494.47 BNB, substantially more than the latest session. That earlier burst failed to produce immediate continuation. A new close above $780.64 would be more persuasive if volume returns above the twenty-day average. A close above resistance on quiet activity could still work, but the retest would carry more of the confirmation burden because thin acceptance is easier to reverse.
The bearish volume pattern would be different: a close below $723.53 with volume expanding above the recent mean. That would show that supply is no longer confined to the resistance zone and is following price into support. A decline on low volume followed by a recovery above $735 would be less threatening. The direction of price matters, but the amount of participation determines how much confidence the move deserves.
🌊 ATR makes a one-day break insufficient evidence
Average True Range over fourteen completed sessions is $23.38, or 3.07% of the last close. From $762.02, one ATR extends to approximately $785.40 on the upside and $738.64 on the downside. The entire $774–$781 resistance zone sits within one normal ATR expansion. BNB can therefore trade through the ceiling during an ordinary session and still close back inside the range without producing an unusual volatility event.
This is why intraday excitement should not replace a completed close. A wick to $785 could trigger breakout orders and short covering, yet still leave the daily structure unresolved if price settles below $774. The same logic applies to support. A temporary move beneath $735 is not automatically a breakdown when one ATR reaches into the high $730s. Acceptance requires time beyond the level, not merely contact with it.
ATR also shapes risk design. A stop placed only a few dollars beyond an obvious BNB level would sit inside routine daily noise. A coherent educational setup ties invalidation to a completed close, a failed reclaim or a level beyond the normal range, then adjusts position size to the distance. The order matters. Position size should adapt to structural risk; structural risk should not be compressed to fit a predetermined position.
🧩 The pattern is a higher-low retest beneath supply
The visible pattern is not a clean ascending triangle, because the higher lows are irregular and volatility remains wide. It is better described as a higher-low retest beneath a horizontal supply shelf. BNB approached $780.64 on September 5, fell toward $704, then rebuilt through $724 and $735. The second approach begins from a higher support base than the August advance, which is constructive. The ceiling remains unchanged, which keeps the market in a decision phase.
The bullish interpretation is absorption. Sellers who defended $780 during the first test may have used part of their available supply, while buyers demonstrated willingness to enter at higher lows. Under this reading, the September 18 expansion and the quiet September 19 pause are preparation for another attempt. The bearish interpretation is distribution: repeated tests provide liquidity for larger holders to reduce exposure, while each push struggles to create durable acceptance above the upper band.
The quality of the next pullback will distinguish these stories. A shallow retreat that holds $735 or EMA 20 would preserve pressure beneath resistance. A deeper move into $704–$713 would keep the larger trend alive but weaken the immediate breakout thesis. A close below $674.60 would break the September higher-low structure and shift the chart from consolidation to medium-term correction.
🟢 Bullish scenario: acceptance above $780.64
The bullish scenario requires a completed daily close above $780.64. Ideally, volume would exceed the twenty-day average and RSI would remain in the 60s rather than spike into an unstable extreme. The next task would be to defend the breakout. A pullback toward $774–$781 that produces a higher low and closes back above the shelf would convert known supply into support. That retest would carry more information than the initial move because it shows whether participants are willing to hold inventory at the new price.
Above confirmed acceptance, $800 is the first psychological reference. The next technical objective is the $820–$830 area, derived from the width of the recent upper consolidation and the tendency of round levels to attract orders. A stronger trend extension could eventually test $850. These are conditional objectives, not predictions. They remain active only while BNB holds the breakout shelf and the moving-average hierarchy stays positive.
The bullish thesis weakens if price trades above $780.64 but closes back below $774. It is invalidated more clearly if the failed breakout is followed by a close below $735 and cannot reclaim the level. That sequence would resemble the September 5 rejection and shift attention from continuation to range rotation. A later recovery could rebuild the setup, but it would be a new attempt rather than confirmation of the original one.
🟡 Neutral scenario: a broad range develops above EMA 20
The neutral scenario is continued movement between approximately $724 and $781. BNB can spend several sessions rotating within that band while EMA 20 rises and momentum cools. This path would not damage the larger bullish trend. It would delay the breakout and make internal structure more important than the range label. Higher lows above $724 would preserve upward pressure; repeated failures below $760 would suggest that demand is tiring.
A healthy neutral range would show volume contracting on declines, RSI oscillating mainly above 50 and EMA 20 continuing to rise. Price could test $735, recover toward $760 and compress beneath resistance without providing a tradable directional signal. Patience is part of the setup. When a market is between confirmation and invalidation, the absence of a position can be a valid response to incomplete evidence.
The range becomes defensive if daily closes cluster below EMA 20 or each rally forms a lower high. A falling upper boundary combined with repeated tests of $704–$713 would transfer pressure from resistance to support. Neutrality is therefore dynamic. It can mature into a continuation base or deteriorate into distribution depending on how price, volume and momentum behave inside the boundaries.
🔴 Bearish scenario: the breakout attempt unwinds
The bearish scenario begins with a rejection from $774–$781 and a completed close below EMA 20 at $723.53. That would place price beneath its short-term trend and expose the $704–$713 support cluster. A weak bounce that fails below $724, followed by acceptance under $704, would confirm that the market has moved from a shallow pullback into a deeper correction.
The next downside objective would be $685–$675. This zone combines EMA 50 with the September 1 swing low and should attract the first meaningful medium-term response. If buyers cannot defend it, EMA 200 near $662.74 becomes active. The broader $650–$663 region also overlaps the August breakout path, making it the chart’s principal long-term regime test.
The bearish thesis is invalidated if a breakdown below $704 is quickly reclaimed and followed by a close above $735. Failed breakdowns can force short sellers to cover while sidelined buyers return. The important evidence is not the first penetration of support but whether BNB can remain below it after the market has had time to react.
🎯 Potential long structures
A confirmation-based long structure would wait for a daily close above $780.64 and evaluate the retest. Its advantage is that the market has already resolved the range. Its disadvantage is a higher entry and wider distance to invalidation. The premise would fail if price closes back below $774 and cannot recover the shelf. A trader using this approach is paying for information rather than trying to predict the breakout in advance.
A support-based long structure would focus on a pullback into $735–$724 that produces a visible reversal, RSI above 50 and improving volume. The advantage is closer structural invalidation and better distance to the ceiling. The disadvantage is that price remains below resistance and can continue ranging. Touching an average is not enough; the setup needs evidence that demand has returned.
A deeper regime long would consider $685–$675 only if price arrives in an orderly manner and then reclaims the band. This is a different thesis from the immediate breakout. It assumes the medium-term uptrend can survive a failed short-term attempt. Because the distance and ATR would be larger, position size would need to be smaller. Mixing a breakout thesis with a mean-reversion entry can create incoherent risk.
🎯 Potential short structures
A rejection-based short structure would require evidence at resistance: an upper wick, a close below $735 and weakening RSI. The first objective would be EMA 20, followed by $704–$713. The risk is that the trader is fading a positive trend before the market has actually lost support. Resistance alone is not enough when price is above all major averages.
A breakdown-based short structure would wait for a completed close below $704 and a failed reclaim. The $685–$675 band would become the first major objective, with EMA 200 near $663 behind it. The advantage is stronger confirmation. The disadvantage is reduced distance to support and the possibility of a bear trap. A recovery above $724 would undermine the premise.
Both approaches must respect the $23.38 ATR. BNB can move more than twenty dollars in an ordinary completed session, so tight invalidation around round numbers is vulnerable to routine noise. The setup should determine the risk point, and the position should be sized around that risk. Reversing the sequence turns a technically sound idea into a fragile implementation.
🧭 Block2Learn base case
The Block2Learn base case is a constructive retest with buyers holding a modest advantage. Price is above EMA 20, EMA 50 and EMA 200; RSI is strong without being overbought; and the September 18 expansion carried above-average participation. The latest completed candle held most of that advance on lower volume. Those factors support another attempt at the $774–$781 zone.
The edge is not large enough to call the breakout confirmed. MACD is positive at 19.55, but its signal line is slightly higher at 19.93, leaving a histogram of -0.38. Momentum is therefore strong in absolute terms but no longer accelerating. The upper Bollinger Band at $774.06 also overlaps the first layer of resistance. The most probable near-term path is a test of the ceiling followed by either acceptance above $780.64 or a pullback toward $735–$724.
A close above $780.64 upgrades the base case to bullish continuation. A close below EMA 20 downgrades it to range rotation. Acceptance below $704 shifts the focus to $685–$675 and changes the immediate trend from constructive to corrective. This hierarchy prevents one live candle from forcing an emotional change in thesis.
🌐 BNB within the broader crypto rotation
BNB’s setup should be read alongside the broader market rather than in isolation. The latest Bitcoin technical analysis also identified a market pressing against resistance after a strong recovery. When Bitcoin and major altcoins test ceilings together, correlations can rise and individual breakouts may depend on whether liquidity expands across the market or concentrates in one asset.
The latest Block2Learn newsletter examined a similar principle in traditional assets: a calm headline index can hide unstable leadership beneath the surface. Crypto behaves the same way. A firm Bitcoin price does not guarantee that every altcoin breakout will hold. BNB needs its own volume, momentum and acceptance even when the broader tape is supportive.
Regulatory and infrastructure developments can also change the risk premium without invalidating the chart framework. The recent analysis of CFTC relief for passive crypto software showed how legal boundaries can reshape wallet and gateway economics. Such news may accelerate a move, but the levels remain the measurement tool. A headline is meaningful when price can close beyond resistance or when support fails after the market absorbs it.
⚖️ Risk, uncertainty and confirmation
The first uncertainty is the live candle. BNB was near $749.84 during the observation, but the September 20 session was incomplete. Its final high, low, close and volume can differ materially. All indicators and level calculations in this analysis use 999 completed Binance Spot BNB/USDT daily candles through September 19. The live quote is context, not evidence for RSI, MACD, ATR or moving averages.
The second uncertainty is venue coverage. Binance supplied the coherent primary series and two native live-price checks. Alpaca did not return a BNB/USD snapshot, and the public CoinGecko route was unavailable. The analysis therefore does not claim independent-venue confirmation. Exact prints belong to the Binance market; levels are expressed as zones to reduce false precision and to acknowledge that other venues can differ.
The third uncertainty is leverage. Crypto derivatives can create liquidation cascades that push spot price through obvious levels before cash demand establishes acceptance. A fast wick above $780.64 or below $704 may reflect forced flow rather than durable conviction. Confirmation is strongest when the market closes beyond the boundary, participation supports the move and the subsequent retest holds.
The active Binance BNB/USDT spot market is the primary price and volume source. The hierarchy is simple: $780.64 confirmation for the bullish case, $774 first acceptance, $735–$724 trend support and $704 structural invalidation. For the bearish case, $704 is confirmation, $685–$675 is the first acceptance zone and a recovery above $735 is invalidation.
🔮 Final outlook
BNB has repaired enough of its daily structure to challenge resistance from a position of strength. The $762.02 completed close sits above the major exponential averages, RSI 14 is 65.49 and the September 18 advance occurred with credible volume. The last session then paused on lighter activity instead of unwinding the move. Those are meaningful positives.
The $774–$781 supply shelf is equally meaningful. BNB already tested it once in early September and failed to establish acceptance. A completed close above $780.64 would open $800 and then $820–$830. A close below $723.53 would return the market to range conditions, while acceptance below $704 would expose the $685–$675 regime band. Between those boundaries, the chart remains a constructive but unconfirmed breakout test.
Readers who want to turn this framework into a repeatable process can continue through the Block2Learn Learning Path. The method is portable: separate completed evidence from live movement, define trend and volatility, map confirmation and invalidation, and update the base case only when price, momentum and participation align.
Learn continuously. Build deliberately.
This article is provided solely for informational and educational purposes and does not constitute financial or investment advice, a recommendation, or an offer or solicitation to buy or sell any financial instrument or digital asset. See our Financial Disclaimer.
This article was generated with the support of AI and reviewed by the Editorial Team. For more information, see our Terms of Service.