Nike Dow risk is no longer a story about whether one battered consumer brand still deserves a place among America’s corporate icons. It is a story about how a century-old index turns a company’s nominal share price into influence, how that design can make an economically important business almost invisible, and why investors should separate the symbolism of Dow membership from the mechanics that actually move capital.
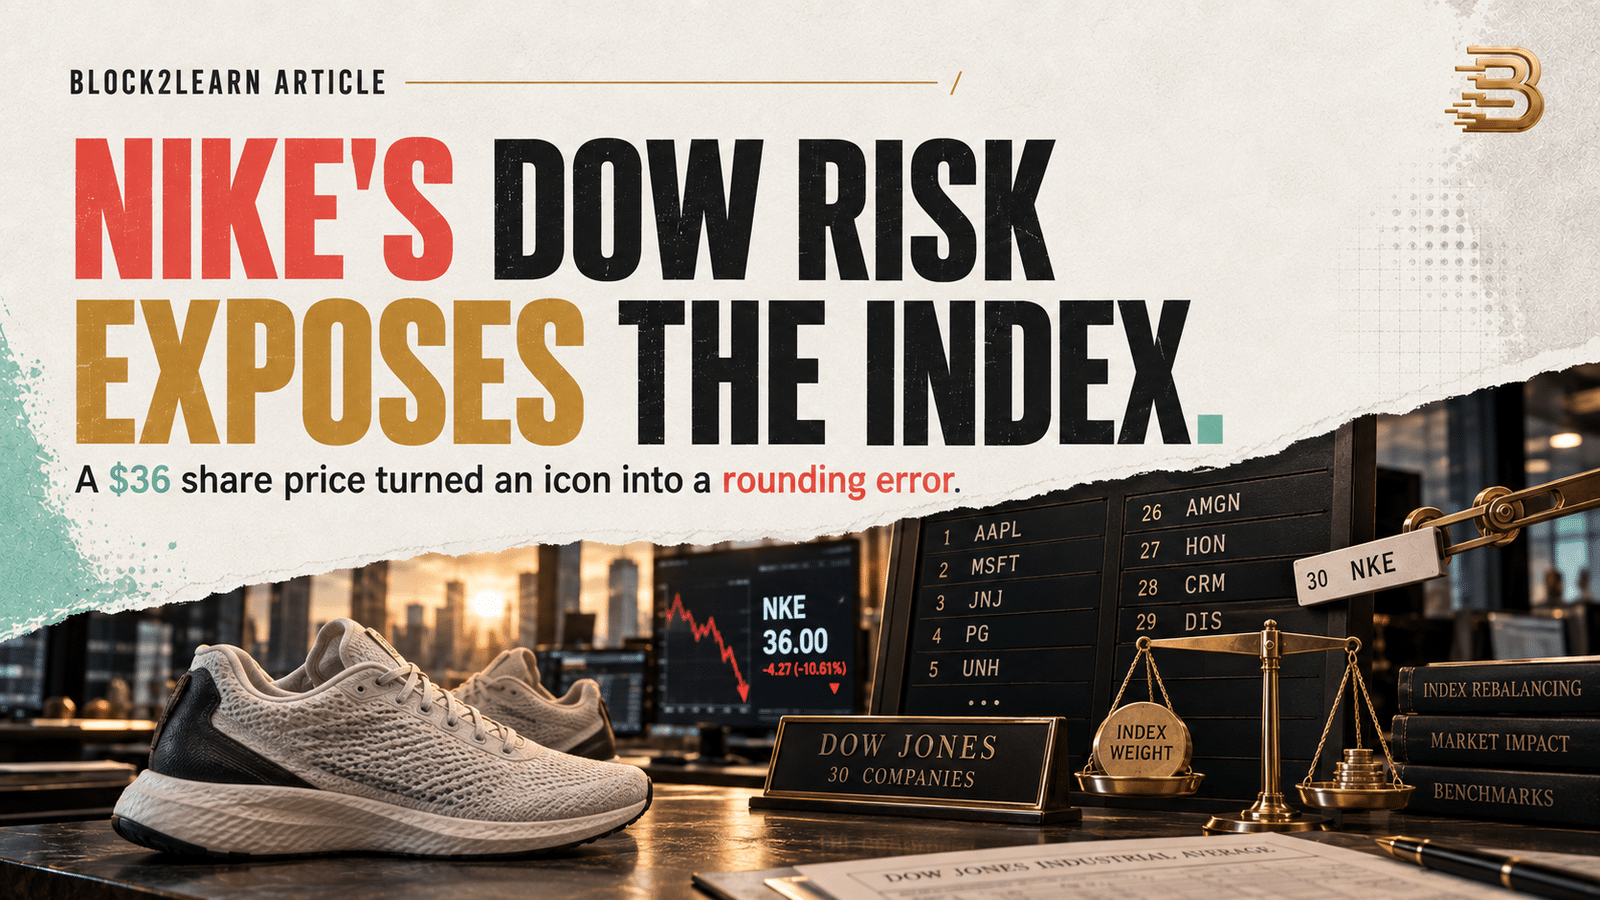
Nike is due to leave the S&P 100 after nearly eighteen years, while its collapse to roughly $36 a share has made it the smallest weight in the Dow Jones Industrial Average. Reuters reported that the stock now contributes only about 0.4% of the price-weighted Dow and that its market value has fallen by roughly 80% from the five-year peak. Those figures do not prove that the Dow’s Averages Committee will remove Nike. The committee follows judgment rather than a mechanical relegation rule. They do, however, create an unusually clean test of what the Dow is trying to represent in 2026.
The immediate temptation is to read the index question as a verdict on Nike’s turnaround. That is too simple. Nike still produces tens of billions of dollars in annual revenue, retains a globally recognized brand and remains in the broad S&P 500. Yet the same company can become nearly irrelevant inside the Dow because the Dow does not weight constituents by market capitalization, revenue, profit or economic footprint. It weights them by the price of one share. The difference is not a footnote. It is the central mechanism behind the Nike Dow risk.
Nike Dow Risk Begins With Two Different Judgments
The S&P 100 and the Dow answer different questions. The S&P 100 is designed to capture large, established U.S. companies and is weighted by float-adjusted market capitalization. A company whose market value shrinks relative to larger peers can lose its place as the index is rebalanced. Nike’s scheduled departure therefore says something direct about scale: after a severe destruction of equity value, it no longer fits comfortably among the hundred largest and most representative blue chips.
The Dow is different. It contains only thirty companies and is curated as a cross-section of major U.S. industry leaders. The official S&P Dow Jones Indices description calls it a price-weighted measure of U.S. blue-chip companies. The committee considers reputation, sustained growth, investor interest and sector representation, but it has no public formula saying that a company must be removed after its share price or market value crosses a fixed line.
That discretion creates two separate judgments. One is economic: has Nike lost enough scale and strategic relevance to make another company a better representative of American business? The other is mathematical: has Nike’s low nominal price made it too weak a component to matter inside a price-weighted average? The first is about the company. The second is about index architecture.
Conflating them produces bad analysis. A company can remain economically important while exerting little influence on the Dow. Conversely, a high-priced stock can receive a large Dow weight even if another company has a much larger market capitalization. The committee must therefore balance representation against the quirks of its own weighting method.
How Price-Weighted Indexing Changes the Meaning of “Large”
In a market-capitalization-weighted index, weight broadly follows the value investors assign to a company’s equity. If Company A is worth ten times Company B, its movement usually matters about ten times as much, subject to free-float adjustments and index rules. This method has its own concentration problems, especially when a handful of mega-cap technology companies dominate the market. Block2Learn examined that tension in our analysis of Nvidia earnings risk and S&P 500 concentration. But at least the weighting mechanism corresponds to market value.
In the Dow, a stock’s influence is proportional to its share price. The index adds the prices of the thirty constituents and divides the total by a divisor that is adjusted for splits, spinoffs and component changes. A one-dollar move in any constituent produces the same point impact regardless of the company’s size. What differs is the percentage move required to create that dollar change.
Consider a simplified example. A $400 stock rising 1% adds $4 to the price sum. A $40 stock must rise 10% to add the same $4. The higher-priced stock therefore carries roughly ten times the weight, even if the lower-priced company is larger by market capitalization. Nike near $36 can experience a dramatic percentage move and still contribute less to the Dow than a modest move in a stock trading several hundred dollars per share.
| Index design | Primary weighting input | What a large weight means | Main distortion |
|---|---|---|---|
| Dow Jones Industrial Average | Nominal share price | A high price per share | Stock splits and share-price conventions affect influence |
| S&P 500 / S&P 100 | Float-adjusted market value | A large public equity value | Mega-cap concentration can dominate returns |
| Equal-weighted index | Equal constituent allocation | Membership itself | Smaller companies receive more influence than their scale implies |
This design explains why Nike’s low weight is not merely the market punishing weak fundamentals. It is also the Dow translating a low nominal share price into low index influence. A stock split would normally reduce a company’s Dow weight even though the split changes nothing about enterprise value. The divisor preserves the index level at the moment of the split, but the constituent’s relative influence after the split falls. That is one reason price weighting is simple to calculate yet difficult to defend as an economic map.
The Dow survives because it is familiar, continuous and culturally powerful. Its daily point changes have framed market news for generations. The index is not useless; it is simply answering a narrower question than many headlines imply. It tracks a curated basket through an inherited arithmetic convention. Investors who treat it as a complete representation of U.S. equity value ask it to do a job it was never designed to perform.
Nike’s Collapse Is Still a Fundamental Story
Index mechanics do not absolve Nike. The company’s shrinking weight reflects a real destruction of shareholder value. The latest fiscal 2026 results show full-year revenue of $46.4 billion, flat on a reported basis and down 2% on a currency-neutral basis. Net income was about $3.1 billion and diluted earnings per share were $2.10. Those numbers describe a profitable global company, but not one producing the growth that previously justified a premium valuation.
The deeper problem is that Nike’s strategic errors attacked several parts of its economic engine at once. Its aggressive shift toward direct-to-consumer distribution weakened relationships with wholesale partners that had provided reach, merchandising expertise and physical discovery. At the same time, dependence on established franchises reduced the pace of product renewal. Newer and more focused rivals gained attention in running, lifestyle and performance categories. China became a harder growth market as domestic brands improved and local consumer preferences changed.
That combination matters because a consumer brand is not valued only on current revenue. It is valued on the durability of pricing power, cultural relevance, product innovation and distribution efficiency. When all four are questioned simultaneously, the valuation multiple contracts before the income statement reaches a final bottom. The share price can therefore fall much faster than revenue.
CEO Elliott Hill’s turnaround is attempting to reverse the damage by restoring sports credibility, rebuilding wholesale relationships, accelerating product cycles and reducing dependence on a small number of lifestyle franchises. Those steps are strategically coherent. They are also expensive and slow. Wholesale partners need evidence that Nike will support them consistently. Athletes and consumers need products that feel new rather than repackaged. Inventory must be cleared without training customers to wait for discounts. Marketing must rebuild desire while margins face pressure.
The fiscal 2026 results contained evidence of stabilization, but also reasons for caution. A reported improvement can be flattered by one-time items, currency moves or easier comparisons. The more important indicators are full-price sell-through, regional revenue quality, wholesale order momentum, digital traffic that converts without heavy discounting and gross margin after exceptional factors. Nike’s index status will not repair those operating variables. Only execution can.
Why the S&P 100 Exit Matters More for Forced Flows
The removal from the S&P 100 is more likely to create direct portfolio activity than speculation about the Dow. Funds and mandates that explicitly track the S&P 100 must sell Nike when the rebalance becomes effective and buy the incoming constituents according to their index weights. The amount is limited by the assets tied to that benchmark, which are far smaller than the capital tracking the S&P 500, but the flow is mechanical rather than interpretive.
This is the same market-structure mechanism discussed in our analysis of Nasdaq 100 inclusion and passive inflows: when membership changes, index funds trade because their mandate requires alignment, not because portfolio managers independently changed their fundamental view. Liquidity providers anticipate the rebalance, arbitrageurs position around expected closing demand, and active investors decide whether the forced move has created a temporary dislocation.
The crucial distinction is between price pressure and information. Forced selling can push a stock lower around an effective date, but it does not automatically reveal new information about future cash flows. The removal itself may reflect information already embedded in market value. Investors must therefore ask whether the flow creates an opportunity or simply exposes a deteriorating business that the market had priced correctly.
For Nike, the answer depends on the turnaround evidence. If revenue quality, product velocity and margin discipline improve, mechanical selling can become a source of temporary excess supply. If the business continues losing relevance, the index exit is not a mispricing catalyst; it is one more stage in a longer repricing. The same event can be technical in execution and fundamental in origin.
Dow Removal Would Be Symbolic Before It Is Financial
A Dow removal would attract more attention because the index remains the most recognizable shorthand for American blue-chip status. Nike joined in 2013 as consumer brands and global growth became more important to the U.S. market narrative. Losing that seat would tell a powerful story: a company once treated as a model of brand strength had fallen far enough for the committee to seek a more representative substitute.
Yet the direct forced-flow effect would likely be less important than many readers assume. The Dow is widely quoted, but significantly more capital is benchmarked to broad market-cap-weighted indices. Exchange-traded products and derivatives linked to the Dow still matter, and component changes require real trades. However, the economic consequence of removal should not be confused with the cultural consequence.
The symbolism can still influence behavior. Corporate leaders care about prestige. Analysts may interpret removal as confirmation that a turnaround has not yet earned institutional confidence. Retail investors may treat the headline as a sell signal. Media coverage can reinforce the narrative of decline. These feedback effects are real, but they are second-order. They do not change Nike’s factories, contracts, product pipeline or customer demand on the day the committee announces a decision.
The Dow’s committee also faces a representation problem. Removing Nike would create a vacancy that could be filled by a company with a higher share price, stronger growth and greater contemporary relevance. But a replacement that is already heavily represented through technology or financial exposure could make the thirty-stock basket less balanced. The committee is not merely ranking companies; it is curating a story about the U.S. economy.
What a Replacement Would Say About the American Market
Every Dow change is an editorial act expressed through index governance. A new component signals which sectors and business models are considered central to American corporate leadership. The rise of cloud infrastructure, cybersecurity, semiconductors and digital platforms has made several technology companies plausible candidates. Yet adding another technology name could deepen an imbalance between the structure of the modern market and the Dow’s goal of broad sector representation.
This tension mirrors the broader concentration question explored in our article on U.S. stock-market records, AI leadership and macro risk. Market-cap-weighted indices have become more concentrated because a small group of companies created enormous value. A curated index can resist that concentration, but doing so may make it less representative of actual market capitalization. There is no neutral solution. Each methodology embeds a view of what “the market” should mean.
A consumer company replacing Nike would preserve sector balance but could appear to swap one brand cycle for another. An industrial or healthcare company might improve diversification. A high-priced technology company would increase the Dow’s sensitivity to that stock because of price weighting. The nominal share price of the replacement is therefore not just an implementation detail; it changes the index’s behavior.
This is why the committee’s discretion matters. It can consider share price, sector balance, reputation and sustained growth together. But discretion also limits predictability. Investors cannot calculate the next component from a transparent score. They can estimate likely candidates, yet the final decision remains a governance judgment.
The Consumer Cycle Behind Nike’s Market Problem
Nike’s weakness also belongs to a broader consumer story. Aggregate household income can look resilient while spending power remains uneven across income groups, categories and regions. Our recent analysis of the uneven U.S. consumer recovery showed why headline income data can conceal pressure beneath the average. Premium brands feel that divergence through traffic, discount sensitivity and channel mix.
Sportswear sits at an awkward intersection. It can behave like a staple when consumers repeatedly buy trusted athletic products, but like a discretionary fashion category when novelty and cultural heat drive demand. Nike must therefore manage both functions. Performance credibility supports durable demand; fashion relevance creates higher-margin excitement. Losing either weakens the other.
Interest rates add another layer. The Federal Reserve’s September policy decision reinforced the reality that financing conditions remain restrictive. Higher borrowing costs affect retailers, suppliers and households. They also raise the discount rate applied to long-duration brand turnarounds. Investors become less willing to pay today for profits that may return several years from now.
Recent U.S. retail-sales data can help locate the consumer cycle, but Nike’s challenge cannot be reduced to macro demand. Competitors operate in the same economy. Relative product appeal, distribution choices and regional execution determine who gains share inside a difficult market. A weak consumer can explain some pressure; it cannot explain years of underperformance by itself.
What Investors Should Measure Instead of Index Headlines
The index debate is useful only if it directs attention toward better questions. For Nike, five operating indicators matter more than whether the Dow committee acts this month.
First, product velocity. Investors should watch the share of revenue coming from genuinely new franchises rather than refreshed colorways of legacy products. A turnaround needs evidence that innovation is broad enough to change consumer behavior.
Second, full-price demand. Revenue supported by discounts does not carry the same information as revenue earned at full price. Promotions can clear inventory and protect channel relationships, but persistent discounting damages brand equity and gross margin.
Third, wholesale normalization. Rebuilding external distribution is not simply a matter of shipping more units. The quality of sell-through, shelf placement and retailer confidence determines whether wholesale becomes a durable growth channel rather than an inventory outlet.
Fourth, regional quality. China deserves particular attention, but investors should avoid treating the geography as one number. Local competition, digital platforms, product preferences and macro conditions interact. Currency-neutral growth and profitability are more informative than reported revenue alone.
Fifth, cash conversion. A brand turnaround can consume cash through inventory, marketing and channel investment before accounting profit improves. Free cash flow, working capital and inventory aging reveal whether the strategy is becoming economically productive.
Those measures also provide a framework for interpreting index-related volatility. If operating evidence improves while forced selling intensifies, the gap may create opportunity. If the evidence deteriorates, a lower price is not automatically value. The index event changes ownership; it does not determine intrinsic value.
Three Scenarios for Nike and the Dow
Scenario one: Nike remains in the Dow and the turnaround stabilizes. The committee could conclude that the brand still represents a major part of the U.S. consumer economy and allow management more time. If product and wholesale indicators improve, the stock could recover, gradually restoring its weight. In this case, today’s Nike Dow risk would look like a warning rather than a final judgment.
Scenario two: Nike remains, but its influence keeps shrinking. The committee may avoid an immediate change even as the stock remains depressed. Nike would then occupy a symbolic seat while contributing little to index movement. That outcome would preserve continuity but sharpen criticism of price weighting: an iconic constituent could remain present without materially shaping the benchmark.
Scenario three: Nike is removed. The immediate result would include benchmark rebalancing, headline pressure and a loss of prestige. The longer-term effect would depend almost entirely on execution. Companies can recover after index removal, and index membership does not create consumer demand. A credible turnaround could eventually make the removal look backward-looking. Continued weakness would make it look overdue.
None of these scenarios should be assigned certainty before the committee acts. Reuters’ reporting establishes that the risk has become plausible, not that a decision has been made. The distinction matters because trading a rumor as if it were an announced event can convert sound analysis into poor execution.
Nike Dow Risk Reveals a Benchmark Governance Problem
The most important lesson is not whether Nike deserves sympathy. It is that indices are governed products, not natural facts. Their rules determine which companies matter, how much they matter and when ownership must change. Price weighting, market-cap weighting and equal weighting each create different portfolios from the same market.
The Dow’s design offers continuity and simplicity, but it also allows nominal share prices to shape economic representation. Nike’s 0.4% weight makes that weakness visible. A globally significant company can become almost irrelevant to the index because its shares trade at a low dollar price. That outcome is mathematically consistent and economically awkward.
Market-cap weighting solves the nominal-price problem but creates another: the largest winners receive the largest weights after their valuations have already expanded. Equal weighting reduces concentration but requires frequent rebalancing and gives smaller companies influence beyond their market scale. Investors should therefore choose benchmarks based on purpose, not fame.
For measuring the broad U.S. equity market, a diversified market-cap-weighted index is generally more representative. For understanding a curated group of blue-chip companies with deep historical continuity, the Dow remains useful. For evaluating Nike, neither index can substitute for business analysis.
The Real Test Is Not Membership but Relevance
Nike Dow risk matters because it compresses three stories into one headline: a damaged brand, a changing consumer economy and an index methodology inherited from another era. The company’s fall explains why the question arose. Price weighting explains why its influence has become so small. Committee discretion explains why no formula can tell investors what happens next.
Nike’s management cannot solve this problem by lobbying for symbolic status. It must rebuild product authority, distribution quality and profitable demand. If those improve, market value and share price can recover whether or not the company remains in the Dow. If they do not, continued membership would be ceremonial protection rather than evidence of strength.
For investors, the correct response is to separate forced flows from fundamentals, symbolism from cash generation, and index design from economic scale. The Dow may decide which logo belongs in its thirty-company portrait. The market will decide whether Nike has earned a higher valuation.
Continue Through the Block2Learn Learning Path
Understanding Nike’s index problem requires more than knowing a ticker or reading a rebalance headline. It requires a structured view of equity valuation, consumer economics, benchmark construction, passive flows and risk management. The Block2Learn Learning Path builds those layers progressively.
Free Start introduces the language of markets and indices. Foundation develops the relationship between business quality, valuation and capital allocation. The Investor Operating System turns those ideas into a repeatable decision process, while Trading explains how rebalances, liquidity and positioning can move price around known events. Wealth Strategy places a single-stock thesis inside a broader portfolio, and Framework integrates the evidence into a complete operating system.
That structure is especially valuable when a famous index creates a dramatic narrative. The headline may concern membership, but the investment question remains grounded in cash flows, competitive position, price and time horizon.
Information is abundant. Structure is rare.
This article is provided solely for informational and educational purposes and does not constitute financial or investment advice, a recommendation, or an offer or solicitation to buy or sell any financial instrument or digital asset. See our Financial Disclaimer.
This article was generated with the support of AI and reviewed by the Editorial Team. For more information, see our Terms of Service.