Apple is testing whether a launch-day pullback is only a pause inside a strong daily trend or the first sign that a crowded breakout is losing control. AAPL finished September 17 at $337.00 after reaching $338.34, then traded near $334.74 during the still-open September 18 session. The immediate chart is constructive: the completed close sits above the 20-day EMA at $323.85, the 50-day EMA at $316.93 and the 200-day EMA at $289.16. Momentum is positive without being extreme, with closed-candle RSI at 65.39 and a positive MACD histogram. The tension comes from location. Price is pressing the upper Bollinger area near $339.28 and remains below the prior swing high at $344.57. That leaves AAPL in a narrow decision corridor where buyers have the trend but no confirmed escape from overhead supply.
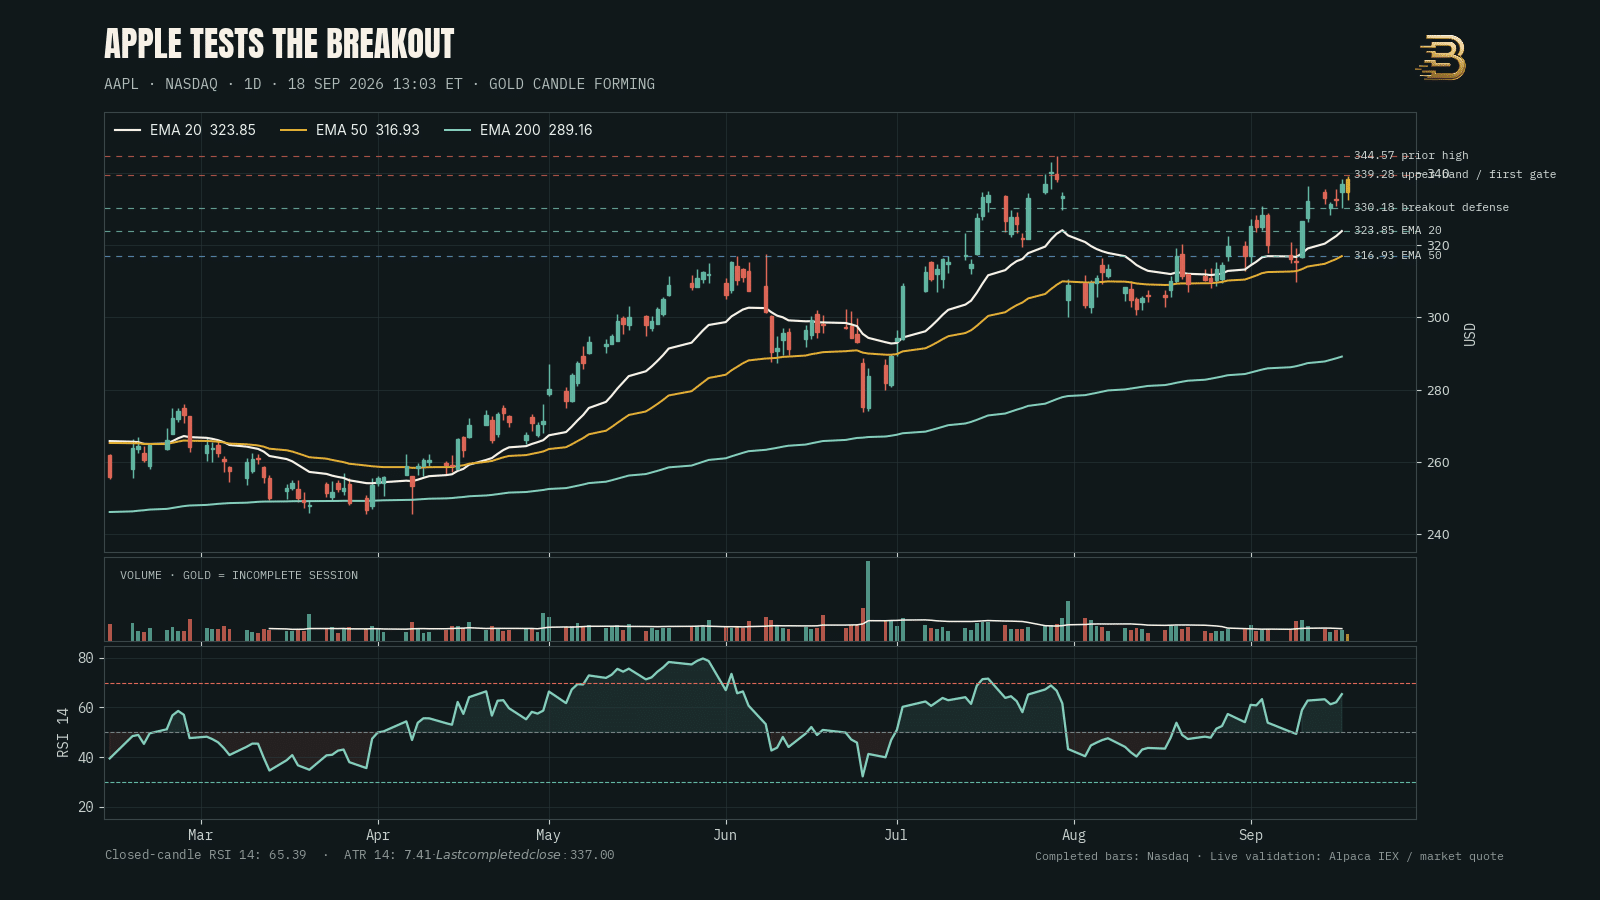
The structure can be reduced to three levels. A close above $339.28 would reopen the path toward $344.57, but only a completed daily break above $344.57 would confirm genuine range expansion. The first defense is $330.18, the low of the September 17 breakout candle and the area the live session is currently testing. Below it, the rising 20-day EMA near $323.85 becomes the more important trend support. Apple therefore does not need to rally immediately to preserve its bullish structure. It needs to hold the breakout shelf, absorb launch-day selling and prevent a normal pullback from turning into a close below the short-term trend.

🧭 Apple’s Daily Trend Is Stronger Than the Intraday Pullback
The dominant daily trend remains bullish. The completed close is about 4.1% above the 20-day EMA, 6.3% above the 50-day EMA and 16.5% above the 200-day EMA. All three averages are rising, and their order is constructive: the faster average is above the medium average, while both remain well above the long-term baseline. That alignment matters because it shows that recent buyers, medium-term holders and long-horizon participants are all carrying progressively higher average prices. A single red intraday candle does not reverse that architecture.
The trend is not early, however. Apple has advanced 6.37% over the last 20 completed sessions and 7.53% over the last 50. Price has also traveled from an August low of $307.01 to the current resistance corridor in less than a month. That is enough distance to attract profit-taking, especially around a globally visible product launch. Strong trends often become vulnerable not because their fundamental story changes, but because too many participants enter near the same catalyst and expect immediate continuation.
The correct technical distinction is between a pullback and a trend failure. A pullback can retrace toward $330, $327 or even the 20-day EMA while keeping the sequence of higher lows intact. A trend failure would require price to break the breakout shelf, close below the 20-day EMA and then fail to recover it. The live September 18 candle is evidence of pressure, not confirmation of failure. It remains incomplete, and its lower wick near $332.57 shows that buyers are still responding above the first major support.
📍 The $339–$345 Corridor Is the Real Breakout Gate
Apple’s first resistance is the upper Bollinger band near $339.28. Bollinger bands are not hard ceilings, but they identify when price is stretching away from its recent mean. A close through an upper band can mark the beginning of momentum expansion when volume and follow-through improve. It can also become a short-lived exhaustion signal when price closes back inside the band immediately. The reaction around $339 therefore matters more than a brief intraday print through it.
The larger barrier is $344.57, the highest price in the available completed series. That level rejected the July advance and defines the top of the broader range. AAPL can trade above $339 without changing the range. It cannot establish a new price-discovery phase until buyers clear $344.57 on a closing basis and defend the breakout afterward. This is why the current chart is bullish but unfinished: price has rebuilt momentum, yet the market has not accepted value above the prior high.
A convincing breakout would ideally contain three elements. First, the daily candle should close above $344.57 rather than merely leave an upper wick. Second, volume should expand above the 20-day average of roughly 41.2 million shares in the completed Nasdaq series. Third, a subsequent pullback should hold the $339–$345 area as support. When all three appear, former resistance has a better chance of becoming a durable launch platform. Without them, the move remains vulnerable to another failed-high pattern.
🛡️ The $330 Breakout Shelf Is the First Defense
The September 17 candle opened near $334.77, traded as low as $330.18 and closed at $337.00. That session converted the $330 area from immediate resistance into a potential support shelf. The live September 18 low near $332.57 has respected that shelf so far. This is the first constructive observation in the pullback: sellers have pushed price away from the upper band, but they have not yet broken the prior day’s low.
Support is a zone rather than a precise cent. The practical band runs from approximately $330 to the 12-day EMA near $327.32. That range contains the prior breakout low, the short-term average and several recent closes. If Apple holds this cluster through a completed session, the chart can continue consolidating without sacrificing its upward bias. If price closes below it, the market will probably test whether the 20-day EMA near $323.85 can absorb a deeper reset.
The 20-day EMA is the most important short-term trend line because it has risen quickly beneath price. A test of that average would not automatically be bearish. In fact, a controlled pullback toward $324 followed by a strong reversal could improve the chart by reducing momentum crowding and creating a clearer invalidation point. The risk appears if the average flattens, price remains below it and rebound attempts repeatedly fail in the $327–$330 area.
📈 Moving Averages Confirm a Bullish Hierarchy
The 20-day EMA at $323.85 is rising above the 50-day EMA at $316.93. The 50-day EMA, in turn, stands well above the 200-day EMA at $289.16. This is the textbook hierarchy of an established advance. It says nothing about whether Apple will rise tomorrow, but it describes where the weight of recent price history sits. Buyers who entered over shorter windows are carrying higher cost bases, and those cost bases are still moving upward.
The distance between price and the 200-day EMA deserves attention. A 16.5% premium is not automatically excessive for a large technology leader, especially during a strong product cycle. It does mean that the chart has accumulated room for a normal correction without losing its long-term structure. Investors should therefore avoid treating every decline as a structural break. The 200-day EMA becomes relevant only if several shorter supports fail and the medium-term slope begins to roll over.
The 50-day EMA near $316.93 is the boundary between a shallow tactical pullback and a more demanding medium-term test. That area also sits close to the early-September consolidation and the September 8 close. If Apple were to lose the 20-day EMA, the 50-day average would be the next level where buyers could rebuild a higher low. A close below $316 followed by failed recovery attempts would materially weaken the bullish case because it would place price beneath both short and medium trend measures.
⚙️ RSI and MACD Show Positive Momentum Without Euphoria
Closed-candle RSI is 65.39. That is bullish because it remains above the neutral 50 line, but it is not yet above the conventional 70 threshold associated with overbought conditions. RSI should not be used as a mechanical sell signal when it crosses 70; powerful trends can remain overbought for extended periods. In this case, the useful message is that Apple still has momentum room, but it is close enough to the upper zone that a failed breakout could create a negative divergence.
The MACD line is approximately 5.20, above its signal line near 3.51, leaving a positive histogram near 1.69. This configuration supports the bullish trend. It also shows that the short-term average is accelerating away from the longer average. The best confirmation would be a continued expansion in the histogram as price breaks $344.57. If price reaches a new high while the histogram contracts, the advance would be less trustworthy because momentum would fail to confirm price.
There is no completed bearish divergence yet. Apple has not closed above its prior high, so the market has not supplied the second price peak needed for comparison. Traders should resist anticipating a divergence before it exists. The signal to monitor is conditional: if AAPL closes above $344.57 while RSI fails to exceed the level reached during the previous high, momentum would be warning that the breakout is losing force. If both price and RSI make higher highs, the continuation case becomes stronger.
📦 Volume Has Not Yet Confirmed a Launch-Day Expansion
The completed September 17 session recorded about 36.7 million shares in the Nasdaq series, below the 20-day average near 41.2 million. That does not invalidate the advance, but it means the move to $337 lacked a clear participation surge. A breakout through an important range ceiling generally carries more authority when volume rises because it suggests that demand is broad enough to absorb sellers who waited near the old high.
The September 18 session was still open at the analysis cutoff, so its volume cannot be compared directly with a completed day. Live volume was tracking below a full-session average, which is normal before the close. What matters is the final print and, even more importantly, the participation on any future break of $344.57. A quiet consolidation above $330 is acceptable. A low-volume breakout followed by an immediate close back below $339 would be a warning.
Volume should also be read in context. Product launch days can produce heavy news traffic without automatically producing sustained institutional accumulation. The Reuters report on Italian retail-worker strikes during the September 18 iPhone 18 Pro launch adds a headline layer, while the new product cycle introduced on September 9 provides the broader catalyst. The chart must decide whether attention becomes durable demand or only a temporary liquidity event.
🧩 The Pattern Is a High-Level Consolidation, Not Yet a Double Top
Apple’s July high near $344.57 and the current approach toward the same area create the visual possibility of a double top. That label is premature. A double top is not confirmed by two similar highs alone; it requires a break of the intervening support. The relevant neckline is much lower, around the $300–$307 region that contained the August decline. Apple is currently far above it.
The more accurate description is a high-level consolidation beneath major resistance. Price has produced higher lows since late August, recovered above all major moving averages and returned to the upper part of the range. This resembles an ascending pressure pattern because buyers are accepting progressively higher prices while resistance remains approximately fixed. The pattern becomes bullish only when resistance breaks. It becomes a failed accumulation structure if the higher-low sequence breaks.
No important unfilled daily gap controls the immediate setup. The chart is being organized by overlapping candles, rising averages and horizontal resistance rather than by a clean gap magnet. Trendlines are also secondary to the horizontal levels. A rising line drawn beneath the late-August and September lows would support the bullish interpretation, but $330 and $324 offer clearer, more testable reference points than a diagonal line whose placement can vary.
🌐 Broader Market Context Can Amplify the Apple Move
Apple does not trade in isolation. Its nearly $5 trillion market capitalization gives it substantial influence inside capitalization-weighted U.S. indexes. A decisive Apple breakout can support the broader technology complex, while a reversal can tighten financial conditions for index investors even if the company-specific catalyst remains intact. This index effect is different from the price-weighted distortion discussed in our analysis of Nike and the Dow Jones Industrial Average, but the practical result is similar: one large component can shape the headline index narrative.
The macro backdrop also matters. Growth equities remain sensitive to real yields and the market’s interpretation of the Federal Reserve. Our September 18 market briefing explains why a relief rally can still face a rate problem. If yields rise while Apple tests resistance, the valuation pressure can make a breakout harder to sustain. If yields stabilize and technology breadth improves, the same chart has more room to convert momentum into price discovery.
Cross-market signals should be used as filters rather than substitutes for price. The Bank of Japan’s policy shift and the yen reaction, covered in our Bank of Japan analysis, can affect global risk appetite and currency translation. Apple’s chart will ultimately confirm or reject those pressures through its own closes. AAPL above $344.57 is constructive even if the macro narrative is noisy; AAPL below $323.85 is a warning even if the product story sounds strong.
🐂 Bullish Scenario: Price Discovery Above $344.57
The bullish scenario begins with a completed daily close above $344.57. A wick above resistance is insufficient because the prior high is exactly where trapped buyers and profit-takers may supply shares. Confirmation improves if volume exceeds the 20-day average and the candle closes in the upper half of its range. A follow-through session or successful retest would then show that the market accepts the new level rather than merely exploring it.
Above $344.57, the chart enters price discovery. There is no established overhead resistance in the available series, so targets should be treated as measured objectives rather than fixed ceilings. The width between the $330 breakout shelf and $344.57 resistance is roughly $14.4. Adding that distance to the breakout produces an initial measured objective near $359. Shorter-term traders may manage the move around round numbers at $350 and $360 rather than assume a straight path.
The bullish thesis is invalidated if a breakout closes back below $339 and cannot recover within one or two sessions. That would create a classic failed-breakout risk. The strongest version of the bullish setup is therefore not a chase far above resistance. It is either a high-quality close through $344.57 with participation or a controlled retest of the breakout zone that provides a clear stop beneath the reclaimed level.
⚖️ Neutral Scenario: Consolidation Between $324 and $345
The neutral scenario is a range between the rising 20-day EMA near $323.85 and the prior high near $344.57. This is the B2L base case, with an estimated 50% probability over the next several daily sessions. Apple has a strong trend, but completed volume has not yet confirmed a major breakout and the live session is rejecting the upper band. A period of sideways movement would allow the 20-day EMA to rise, absorb launch-day positioning and rebuild energy without damaging the broader structure.
Within this range, $330 acts as the internal pivot. Closes above it keep pressure on resistance. Closes below it shift attention toward $324. A neutral market can produce sharp intraday moves in both directions, so traders should not confuse volatility with trend. The most useful signal is where the day finishes relative to the pivot and whether the next session accepts that close.
The neutral thesis ends when price closes outside the range with confirmation. Above $344.57, the market moves into the bullish scenario. Below $323.85, the probability of a 50-day EMA test increases materially. Until one of those events occurs, patience has value because the middle of the range offers weaker reward-to-risk than either boundary.
🐻 Bearish Scenario: A Failed Launch Breaks the 20-Day EMA
The bearish scenario begins with a close below $330 and becomes credible below the 20-day EMA at $323.85. That combination would show that the September breakout failed and that short-term buyers are underwater. The first downside objective would be the 50-day EMA near $316.93, followed by the $307–$310 August support region. The 14-day ATR near $7.41 suggests that a single daily move can cover much of the distance between these levels, so position sizing matters.
A close below the 50-day EMA would weaken the medium-term chart and expose the broader range floor near $300. The bearish case does not require an immediate collapse. It can develop through repeated failed rebounds beneath $324 and a flattening 20-day EMA. That process would show that former support is turning into supply and that momentum is rotating from consolidation into distribution.
The bearish scenario is invalidated if price quickly reclaims $330 and then closes above $339. Failed breakdowns can be powerful bullish signals because they trap sellers below support. Traders should therefore avoid treating any intraday print under $330 as sufficient confirmation. The daily close and the reaction during the following session carry more information than the first breach.
🎯 Educational Long Setup
A conservative long setup waits for a daily close above $344.57, preferably with volume above the 20-day average. Entry can occur on the breakout close or on a retest of the $339–$345 zone, depending on risk tolerance. The invalidation point sits below the retest low or below $339 if the breakout is clean. Initial management can use $350 as a psychological checkpoint and the measured objective near $359 as a secondary target.
An aggressive long setup uses a confirmed bullish reversal from $330–$327. The ideal candle would probe the support zone, recover and close back above $334. That structure allows a stop beneath the reversal low while targeting $339 and $344.57. The trade has better asymmetry than buying in the middle of the corridor, but it carries greater failure risk because resistance remains overhead.
Neither setup is valid without confirmation. Buying only because the product launch creates excitement confuses narrative with timing. The technical edge comes from defining the entry, the invalidation and the level where the market proves the thesis. If those elements cannot be specified before the trade, the position is a forecast rather than a structured decision.
🧯 Educational Short Setup
A conservative short setup requires a daily close below the 20-day EMA at $323.85 followed by a failed retest from underneath. Entry would occur when the rebound stalls below $324–$327, with invalidation above the retest high. The first objective is the 50-day EMA near $316.93, and the second is the $307–$310 support region. Because the broader trend remains bullish, this setup should demand stronger confirmation than the long case.
An aggressive short setup can appear if Apple trades above $344.57 intraday but closes back below $339. That would form a failed breakout near a major high. The invalidation point belongs above the rejection wick, while objectives return to $330 and then $324. This trade attempts to capture trapped breakout buyers, but it becomes dangerous if price quickly reclaims the range ceiling.
Short exposure should account for gap risk around company news and broad technology moves. Apple can open beyond a planned stop after a major announcement. Smaller sizing and predefined maximum loss are therefore more important than finding a perfect entry. A technically correct thesis can still produce an unacceptable outcome when risk is too large.
🔭 B2L Base Case and Probability Map
B2L assigns a 50% probability to continued consolidation between $324 and $345, a 30% probability to a confirmed breakout above $344.57 and a 20% probability to a bearish break below the 20-day EMA. The base case is neutral-to-bullish because trend alignment, RSI and MACD favor buyers, while the live rejection, below-average completed volume and proximity to the prior high argue against assuming immediate price discovery.
The probability map is dynamic. A high-volume close above $344.57 would lift the bullish scenario above 55% and reduce the neutral case. A close below $323.85 would increase the bearish scenario and make the 50-day EMA the primary test. The estimate is not a promise about the future. It is a disciplined way to express which evidence currently carries the most weight and what new evidence would change the conclusion.
For now, $330 is the tactical pivot, $323.85 is the short-term invalidation line and $344.57 is the breakout gate. Those levels convert a crowded launch narrative into an observable decision tree. Investors do not need to predict the next headline if they know which closes confirm demand and which ones reveal distribution.
⚠️ Risk, Uncertainty and What Would Change the View
The largest uncertainty is that the September 18 candle is incomplete. Its open, high, low, close and volume can change before the U.S. market shuts. All indicators and scenario probabilities therefore rely on completed data through September 17, with the live candle used only as provisional context. This separation prevents an intraday move from being mistaken for a confirmed daily signal.
Data sources can also differ slightly because consolidated market feeds and venue-specific feeds observe different trade sets. The completed Nasdaq series recorded a September 17 close of $337.00, while the Alpaca IEX series showed $337.09. The difference is small and does not alter the levels, but it should not be hidden. Indicators in the snapshot use one coherent completed Nasdaq series; the live price was independently validated near $334.74.
Finally, technical levels are conditional. A large macro shock, product issue, regulatory action or earnings revision can produce a gap through support or resistance. The chart cannot remove that uncertainty. It can only define where the market’s behavior changes enough to justify a different plan. The clearest bullish evidence is acceptance above $344.57. The clearest warning is sustained trade below $323.85. Everything between those levels remains a contest rather than a conclusion.
🧠 Final Outlook
Apple enters the final part of the September 18 session with a strong daily trend and an unresolved breakout. The moving-average hierarchy favors buyers, RSI remains constructive and MACD momentum is positive. Yet price is reacting below the $339–$345 supply corridor, and completed volume has not demonstrated decisive expansion. That combination argues for conditional confidence rather than certainty.
The best outcome for bulls is not necessarily an immediate vertical move. A controlled hold above $330, or even a successful test of the 20-day EMA, could build a more durable platform for a later breakout. The most damaging outcome would be a close below $323.85 followed by a failed recovery, because it would transform a healthy pause into evidence that launch-day demand was exhausted.
Until the range resolves, Apple is a chart to trade around confirmation. Above $344.57, price discovery becomes credible. Between $324 and $345, consolidation remains the base case. Below $323.85, the 50-day EMA near $316.93 becomes the next battlefield. The story is visible in the headlines, but the decision belongs to the daily close.
Learning Path: Continue with our NVIDIA technical analysis to compare how another mega-cap technology leader behaves around a defined pivot, then review the B2L market briefing for the rate context surrounding large-cap growth.
This article is provided solely for informational and educational purposes and does not constitute financial or investment advice, a recommendation, or an offer or solicitation to buy or sell any financial instrument or digital asset. See our Financial Disclaimer.
This article was generated with the support of AI and reviewed by the Editorial Team. For more information, see our Terms of Service.